
FusionReactor APM Gives Me Peace-of-Mind Over In-Memory Caching In ColdFusion
As part of the operation of my ColdFusion application (ie, this blog), I cache a lot of data in-memory. Some of that data is cached up-front in the onApplicationStart() ColdFusion application life-cycle event handler; but, most of it is cached on-the-fly using the double-check locking pattern that I discussed recently. Unfortunately, I have no idea how much "data costs" to store in memory (meaning, how much room it takes up). So, I've always been a bit uneasy knowing that I may one day slam into a hard memory limit. But, all worry is gone now that I've installed FusionReactor's Application Performance Monitor (APM). I can now clearly see how much RAM I've used; and, more importantly, how much dang RAM I have left to play with.
ASIDE: It's not crazy to worry about this kind of stuff. For years, I worried about running out of Primary Key space in my database. And, everyone brushed-off my fears; until this last Thanksgiving, when two of my largest tables suddenly hit the maximum
SIGNED INTvalue, bring part of our production application to a halt.
When someone views a blog post on my blog, I perform a non-trivial amount of work on the back-end in order to prepare the data for viewing. Not only do I have to query the database for the contents, comments, tags, and member data, I then go about using jSoup to normalize the HTML, inject section-title anchor tags, generate preview snippets, and extract OpenGraph / Twitter card metadata. In order to reduce load on the server, I then cache all of this data in-memory so that the next viewer can skip right to the juicy stuff!
To my feeble human mind, this feels like a boat-load of data! And, it's certainly not nothing; but, it's also not nearly as bad as I thought it was. In fact, once I realized that I had plenty of wiggle room to work with, I decided to pre-cache all blog posts up-front during application initialization. If you look in my Application.cfc file, you'll see this as the bottom of my onApplicationStart() event-handler:
component
	output = false
	hint = "I define the application settings and event handlers."
	{

	// ... truncated for demo ...

	public void function onApplicationStart() {

		// ... truncated for demo ...

		// If we're on the live site, pre-load all of the blog posts into memory.
		if ( config.isLive ) {

			application.partials.blogPost.getAllAsync();

		}

	}

}
This method - getAllAsync() - spawns an asynchronous CFThread tag that pulls back all of the active blog post IDs. And then, one at a time, processes and pre-caches the blog-viewing data for each ID, applying all of that jSoup-based normalization. And, when I restart my blog and look at the FusionReactor dashboards, here's what I see:
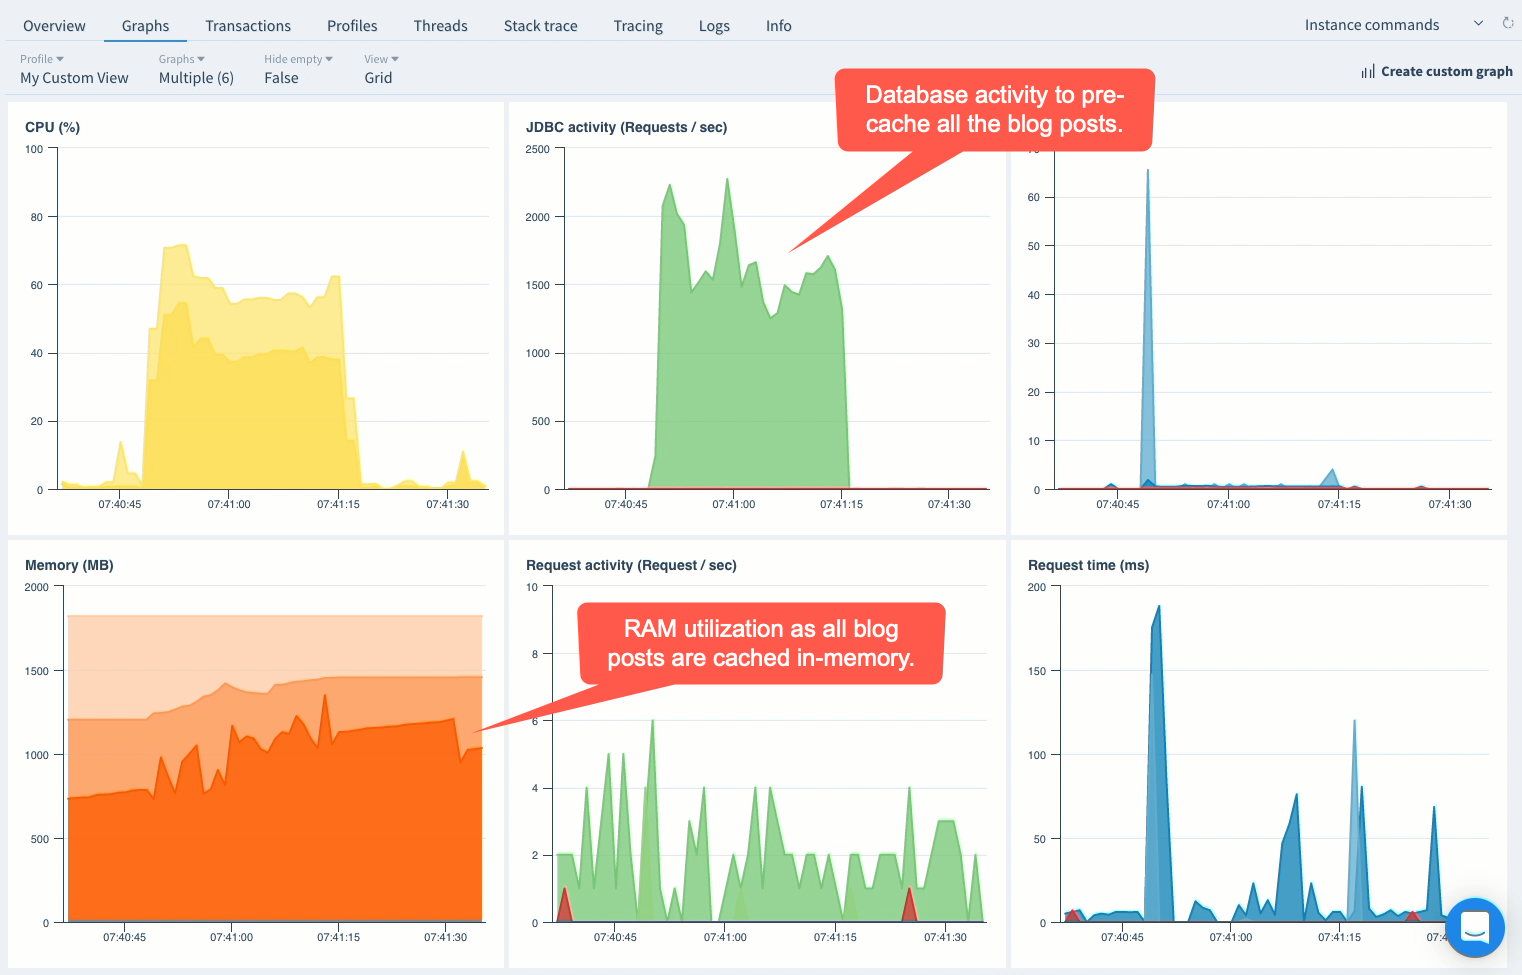
As you can see, there's a massive spike in JDBC (database) activity for about 30-seconds as all of the blog post content is being pre-cached in memory. And, of course, during that time the RAM allocations are going up as well. Some of that RAM allocation is permanent and represents the cached data. But, some of it is transient and represents workflow-related data structures (such as the jSoup Document Object Model), which can be garbage collected once the pre-caching operation is complete.
The graph immediately following the application bootstrapping doesn't even tell the whole story. If I let my ColdFusion application run for another few minutes, the garbage collector really has time to work its magic. And, just 15-minutes later, the same FusionReactor graphs look like this:
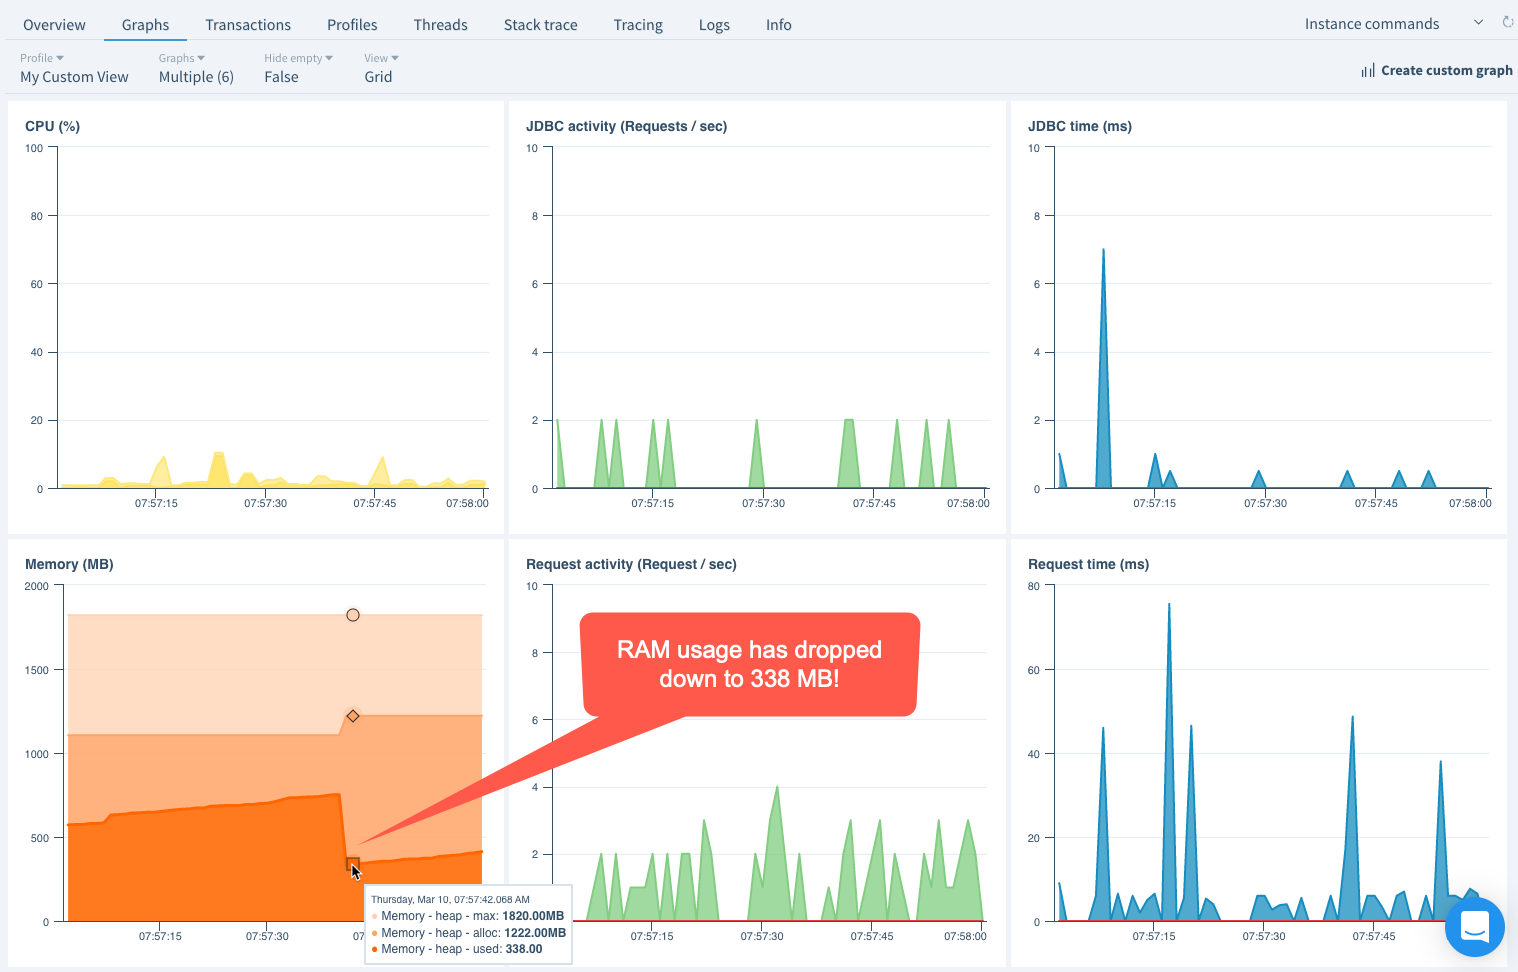
Oh chickens! RAM usage has dropped down to a relatively tiny 338MB! This really puts in-memory caching into better perspective. What feels like a ton of data to my unfrozen caveman lawyer brain is, in reality, trivial for the ColdFusion server to handle.
Now that FusionReactor gives me crystal clear insight into resource allocation on my ColdFusion server, I'm wondering what other kinds of stuff I might be able to jam into the memory space? Time to start looking for other queries and processes that repeat without a dynamic nature.
And, perhaps most importantly, this is just a great reminder that you shouldn't have to guess about anything relating to your application's performance. You need to measure stuff! And then, using actual real-world data, make decisions about what changes you can (or maybe should) make to your logic.
Want to use code from this post? Check out the license.

Reader Comments
Hi ben,
what JVM settings are you using and which version of FR?
@Paolo,
Which JVM settings are you curious about? I'll be honest, I don't know all that much about how the JVM gets configured. It seems to use some sort of cryptic set of flags 😱 I think I have like 2Gb of Max RAM configured. And FusionReactor is on whatever the latest one is. 8-something, I think.