
Using The FusionReactor API (FRAPI) To Add Custom Instrumentation In Lucee CFML 5.2.9.40
Now that InVision is migrating from the New Relic APM to the FusionReactor APM (Application Performance Management) for our Lucee CFML servers, I wanted to take some time to familiarize myself with the API exposed by the FusionReactor Java Agent. On its own, the FusionReactor core functionality is already quite insightful. However, I am constantly using feature flags to experiment with code optimization; so, it would be even more helpful if I could graph the impact of my experimentation alongside the performance of our Lucee CFML 5.2.9.40 servers.
Much like the New Relic Java Agent, once you have the FusionReactor Java Agent installed, you can access its API directly from within your ColdFusion CFML code. I couldn't find many examples of this online. So, much of what follows is based on an old article from the FusionReactor blog, dumping out the FRAPI Java Objects, and several bouts of trial-and-error.
To figure out how everything works, I created a small ColdFusion script that exercises several of the FRAPI methods in the context of a simulated feature flag. The idea below is to branch some CPU-intensive processing, and then use the FusionReactor API to help see which version of the code is more performant.
NOTE: The following CFML code has a lot of comments. Those represents all of the confusion that I had about how things worked, especially with regard to the differences between the Standalone dashboard and the Cloud dashboard.
<cfscript>

	// Get the running FusionReactor API (FRAPI) instance from the FRAPI factory class.
	// --
	// Java Docs: https://www.fusion-reactor.com/frapi/7_0_0/com/intergral/fusionreactor/api/FRAPI.html
	frapi = createObject( "java", "com.intergral.fusionreactor.api.FRAPI" )
		.getInstance()
	;

	// ------------------------------------------------------------------------------- //
	// ------------------------------------------------------------------------------- //

	// By default, FusionReactor will use the name of the application as defined in the
	// Application.cfc ColdFusion framework component. However, we can set the name
	// programmatically.
	frapi.setTransactionApplicationName( "FRAPI-Testing" );

	// By default, FusionReactor will calculate the transaction name based on the request
	// context. It actually seems to "understand" the fact that we're using Framework One
	// (FW/1) in production and uses the "action" value as the transaction name. That's
	// the beauty of using an APM product that is embedded within the ColdFusion and CFML
	// community. That said, we can set the transaction name programmatically.
	// --
	// See Framework Support: https://www.fusion-reactor.com/support/kb/frs-431/
	frapi.setTransactionName( "GET/feature-flag-test" );

	// ------------------------------------------------------------------------------- //
	// ------------------------------------------------------------------------------- //

	// SIMULATE FEATURE FLAG setting.
	shouldUseExperiment = randRange( 0, 1 );

	// We can use the trace() method to aggregate arbitrary time-stamped data along with
	// the request. This data gets placed in a "Traces" tab in the Request detail.
	// --
	// CAUTION: At the time of this writing, this data is not accessible on the Cloud
	// dashboard, only on the STANDALONE dashboard. And, this data SHOULD NOT be
	// confused with the "Tracing" tab on the CLOUD dashboard, which is concerned with
	// nested Transactions only.
	frapi.trace( "Starting Experiment." );
	// Try tracing a Struct.
	frapi.trace({
		usingExpeirment: yesNoFormat( shouldUseExperiment )
	});
	// Try tracing an Array.
	frapi.trace([
		"DATE",
		dateFormat( now() ),
		"TIME (EST)",
		timeFormat( now() )
	]);

	// Let's imagine that this page is going to represent two different algorithms: the
	// base one and an experimental one that we are testing with a feature flag. In
	// order to see if our experiment is worthwhile, we're going to track the relative
	// execution time of each approach.
	startedAt = getTickCount();

	// CASE: Experiment.
	if ( shouldUseExperiment ) {

		frapi.trace( "Starting experimental case." );

		// We can associate arbitrary key-value pairs with the request. These will show
		// up in the "Properties" tab of the request detail.
		// --
		// NOTE: At the time of this writing, these properties are not accessible on the
		// Cloud dashboard, only on the Standalone dashboard.
		frapi.getActiveTransaction()
			.setProperty( "Features - Optimizations - Test", "True" )
		;

		// In addition to the timing metrics which we are going to record, we can also
		// create segments, aka "sub transactions", that help us map the relative
		// execution time for parts of the request.
		// --
		// NOTE: In the CLOUD dashboard, these show up in the "Traces" tab of a
		// Transaction detail. In the STANDALONE dashboard, these who up in the
		// "Relations" tab of a Transaction detail.
		// --
		// NOTE: In the CLOUD dashboard, these can also be found in the "Flavor" dropdown
		// of the Transactions tab. In the STANDALONE dashboard, these can also be
		// graphed under the Transactions section.
		// --
		// NOTE: When naming a transaction, I was running into issues in the STANDALONE
		// dashboard if I used any kind of path-style notation (either "/" or "."): only
		// the last segment of the "path" would show up, but would have no values.
		try {

			subtransaction = frapi.createTrackedTransaction( "HeavyProcessing-Exp-Start" );

			// SIMULTATE algorithm time.
			sleep( randRange( 25, 50 ) );

		} finally {

			subtransaction.close();

		}

		try {

			subtransaction = frapi.createTrackedTransaction( "HeavyProcessing-Exp-End" );

			// SIMULTATE algorithm time.
			sleep( randRange( 25, 50 ) );

		} finally {

			subtransaction.close();

		}

	// CASE: Default.
	} else {

		frapi.trace( "Starting default case." );

		// We can associate arbitrary key-value pairs with the request. These will show
		// up in the "Properties" tab of the request detail.
		// --
		// NOTE: At the time of this writing, these properties are not accessible on the
		// Cloud dashboard, only on the Standalone dashboard.
		frapi.getActiveTransaction()
			.setProperty( "Features - Optimizations - Test", "False" )
		;

		// In addition to the timing metrics which we are going to record, we can also
		// create segments, aka "sub transactions", that help us map the relative
		// execution time for parts of the request.
		// --
		// NOTE: In the CLOUD dashboard, these show up in the "Traces" tab of a
		// Transaction detail. In the STANDALONE dashboard, these who up in the
		// "Relations" tab of a Transaction detail.
		// --
		// NOTE: In the CLOUD dashboard, these can also be found in the "Flavor" dropdown
		// of the Transactions tab. In the STANDALONE dashboard, these can also be
		// graphed under the Transactions section.
		// --
		// NOTE: When naming a transaction, I was running into issues in the STANDALONE
		// dashboard if I used any kind of path-style notation (either "/" or "."): only
		// the last segment of the "path" would show up, but would have no values.
		try {

			subtransaction = frapi.createTrackedTransaction( "HeavyProcessing-Base-Start" );

			// SIMULTATE algorithm time.
			sleep( randRange( 1000, 2500 ) );

		} finally {

			subtransaction.close();

		}

		try {

			subtransaction = frapi.createTrackedTransaction( "HeavyProcessing-Base-End" );

			// SIMULTATE algorithm time.
			sleep( randRange( 1000, 2500 ) );

		} finally {

			subtransaction.close();

		}

	} // END: Processing experiment.

	duration = ( getTickCount() - startedAt );

	// In addition to the Transaction-based recording we're doing above, we can also
	// record custom metrics which we can then graph in the FusionReactor dashboard.
	// --
	// NOTE: FusionReactor's documentation seems to use a path-style notation when naming
	// custom metrics. As such, I am just following the same pattern in the following
	// metric examples.
	// --
	// NOTE: The metrics are always available in the STANDALONE version of the
	// FusionReactor dashboard; but, to stream them to the CLOUD dashboard as well, the
	// metric has to be explicitly enabled with .enableCloudMetric(), and only works for
	// NUMERIC AGGREGATE metrics.
	if ( shouldUseExperiment ) {

		frapi.postNumericAggregateMetric( "/optimizations/exp/duration", duration );
		frapi.enableCloudMetric( "/optimizations/exp/duration" );

	} else {

		frapi.enableCloudMetric( "/optimizations/base/duration" );
		frapi.postNumericAggregateMetric( "/optimizations/base/duration", duration );

	}

	frapi.trace( "Ending Experiment." );

</cfscript>

<!--- ------------------------------------------------------------------------------ --->
<!--- ------------------------------------------------------------------------------ --->

<script>

	// Simulate regular throughput / traffic to this endpoint by refreshing.
	setTimeout(
		function() {
			window.location.reload();
		},
		1000
	);

</script>
As you can see, this ColdFusion code runs, sits there for 1-second, and then refreshes itself using JavaScript. Within the code, I'm using the following FRAPI methods:
setTransactionApplicationName()setTransactionName()trace()getActiveTransaction()setProperty()createTrackedTransaction()postNumericAggregateMetric()enableCloudMetric()
Let's look at these methods individually to see what they do and how they show up in the various FusionReactor dashboards.
FRAPI.setTransactionApplicationName() Method
The Transaction Application Name is the name of the ColdFusion application framework instance that is processing the current request. By default, FusionReactor will use the name that you provide inside the Application.cfc component (using this.name). However, you can override it programmatically as I am doing above.
Since you can have N-number of ColdFusion applications running within a single ColdFusion instance, your FusionReactor dashboard may pickup Transactions from several concurrently-running applications. Having a sensible, human-readable name for your "Transaction Application" name will help differentiate the various recordings within the dashboard.
FRAPI.setTransactionName() Method
Just as with the Transaction Application Name, FusionReactor will automatically get the Transaction Name from current request. And, as an added bonus, FusionReactor is built to understand several of the popular ColdFusion Application frameworks (like ColdBox, Framework/One, and Fusebox). This means that FusionReactor will automatically use the framework action variable to help identify the Transaction.
So, for example, if you were to make a Framework/One (FW/1) request to:
GET /subsystem:section/item/foo/bar/meep/moop/
... FusionReactor would automatically give the Transaction the following name:
subsystem:section/item
Of course, if you are using an unsupported ColdFusion framework, or want to override the Transaction name, you can use the .setTransactionName() method.
ASIDE: It's this kind of tight integration that sets FusionReactor apart from other Java APMs. Yes, it can monitor any type of JVM-based application; but, it clearly goes above and beyond to make ColdFusion developers happy! You gotta love that mindset.
FRAPI.trace() Method
The .trace() method allows you to log arbitrary time-stamped values along with the request. As you can see from my example, I'm logging a String, a Struct, and an Array. Each of these values is handled properly by the FusionReactor API and is rendered within the "Traces" tab of a Transaction detail:
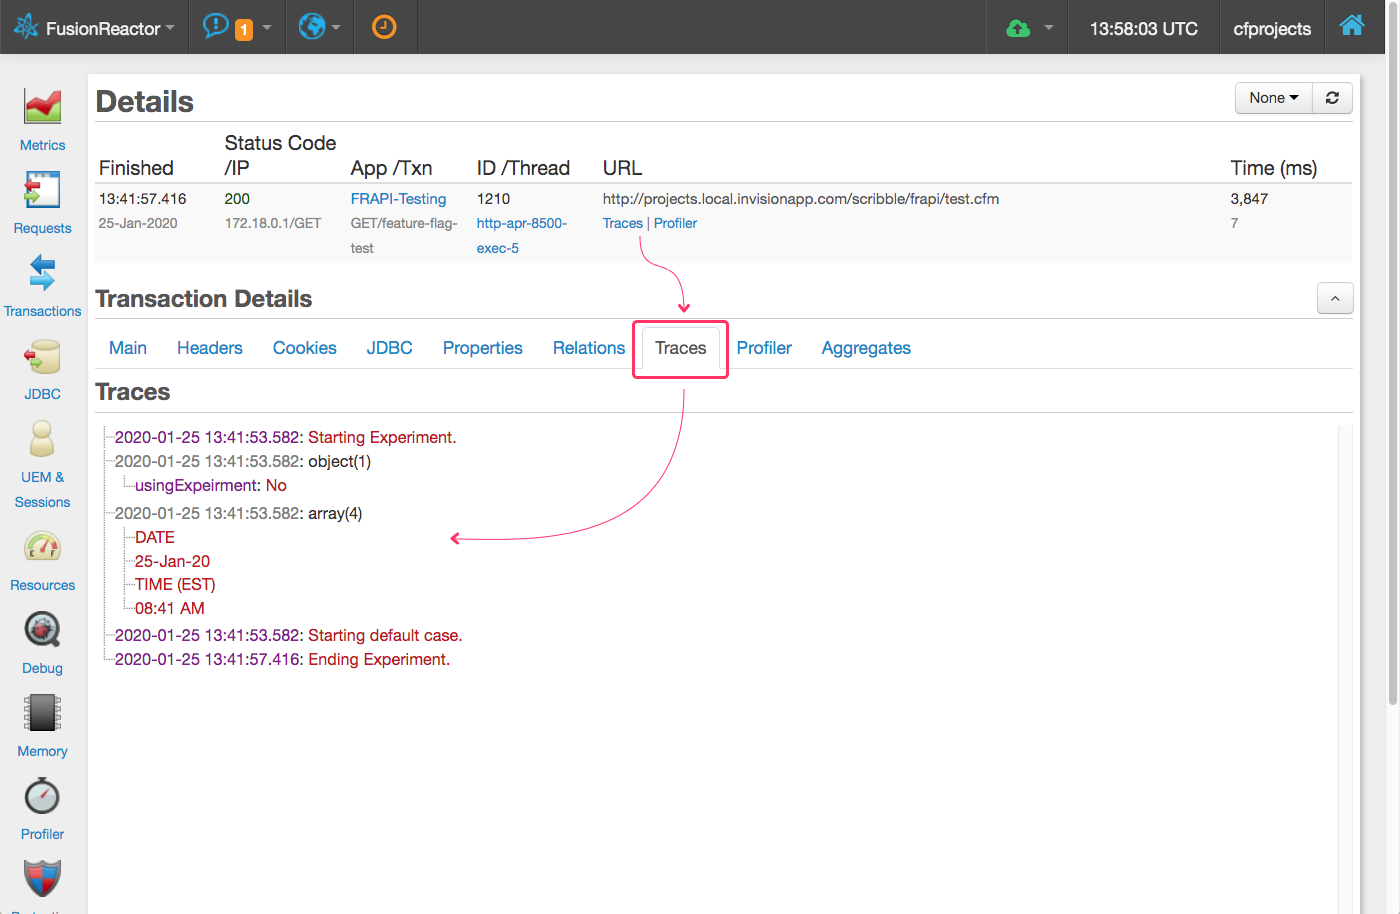
As you can see, the trace output is associated with the Transaction; but, it's not intermingled with the rest of the request metadata - it stands on its own. To get more intermingled timing data, we can use sub-transactions, which we'll look at shortly.
As far as I can tell, the Traces tab is only available in the Standalone dashboard - I could not find this data in the Cloud dashboard. The Cloud dashboard does have a "Tracing" tab; but, that tab deals with sub-transactions, not with the .trace() output.
FRAPI.getActiveTransaction() Method
The .getActiveTransaction() method gives you access to the Transaction associated with the current thread. If you are in the parent request, this gives you the same result as calling .getActiveMasterTransaction() (not demonstrated in my example). However, if you are in a sub-transaction, calling .getActiveTransaction() will give you the sub-transaction, not the master transaction.
NOTE: The
BaseTransactionandTrackedTransctionclasses have a load of methods on them which don't seem to be documented anywhere - not even in the FRAPI Java Docs. To see what is available, you have to grab the Java object anddump()it out to the screen. Among the potentially interesting methods that I saw, there are:
setProperty()setSubFlavour()setExplanation()setDescription()... and many more which may prove interesting for really low-level debugging.
Transaction.setProperty() Method
Once I have the currently-executing Transaction, I call .setProperty() to store arbitrary key-value pairs. The values must be Strings; and are rendered in the "Properties" tab of the Transaction detail:
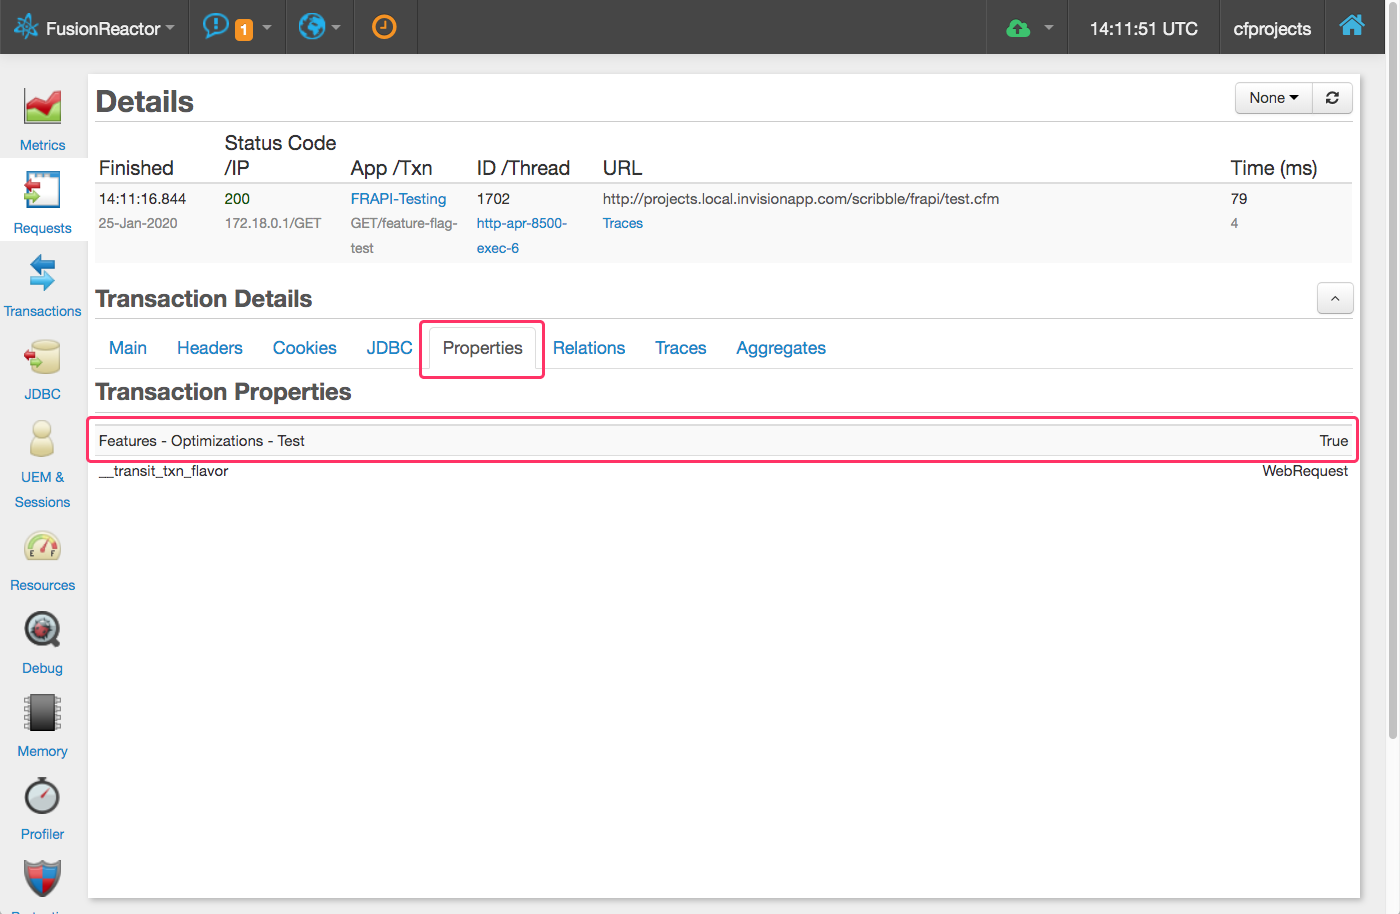
I usually use this type of functionality to store the associated User ID with the request.
I have confirmed with the FusionReactor Support team that the Properties values are only accessible in the Standalone dashboard - these values are not streamed to the Cloud dashboard.
FRAPI.createTrackedTransaction() Method
Creating nested transactions allows us to segment our code in such a way that makes the execution time of the code much more visible within the FusionReactor dashboard. There are two ways to create nested transactions:
.createTrackedTransaction().createTransaction()
CAUTION: Each transaction has to be explicitly closed via
.close(). While I didn't test this, I assume that if you don't call.close(), the timing of the sub-transaction will be corrupted and will likely time-out at some point, making it appear as if the transaction took substantially longer than it really did.
Both of these create a nested transaction that is visible within the breakdown of a parent transaction / request. But, only the "tracked" transaction can be seen in an "activity" graph within the dashboard.
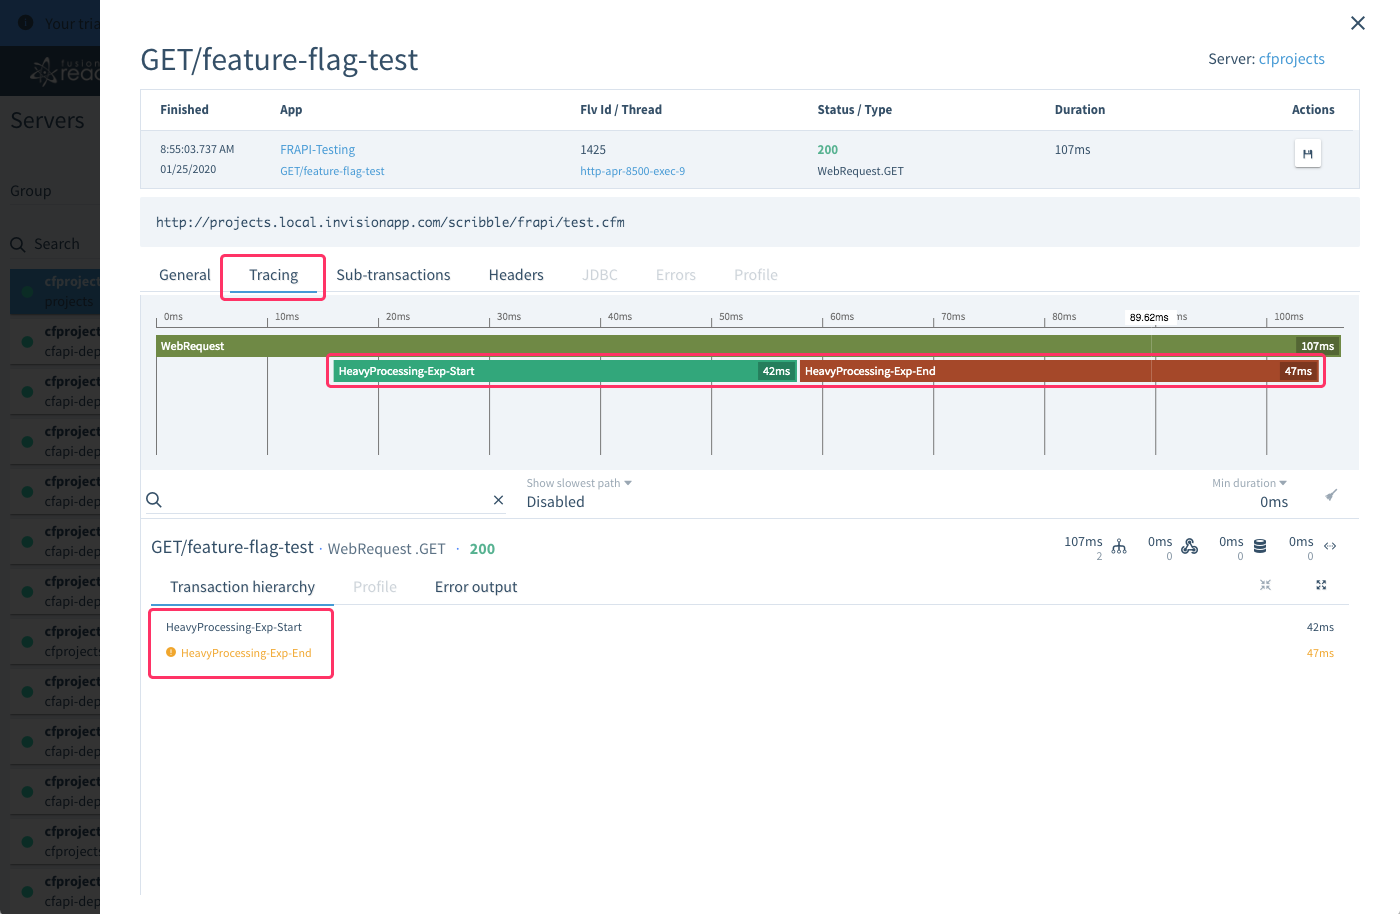
In my demo, each branch of the simulated feature flag is further segmented into two sub-transactions. In the Standalone dashboard, these sub-transactions are visible in the "Relations" tab of a given Transaction:
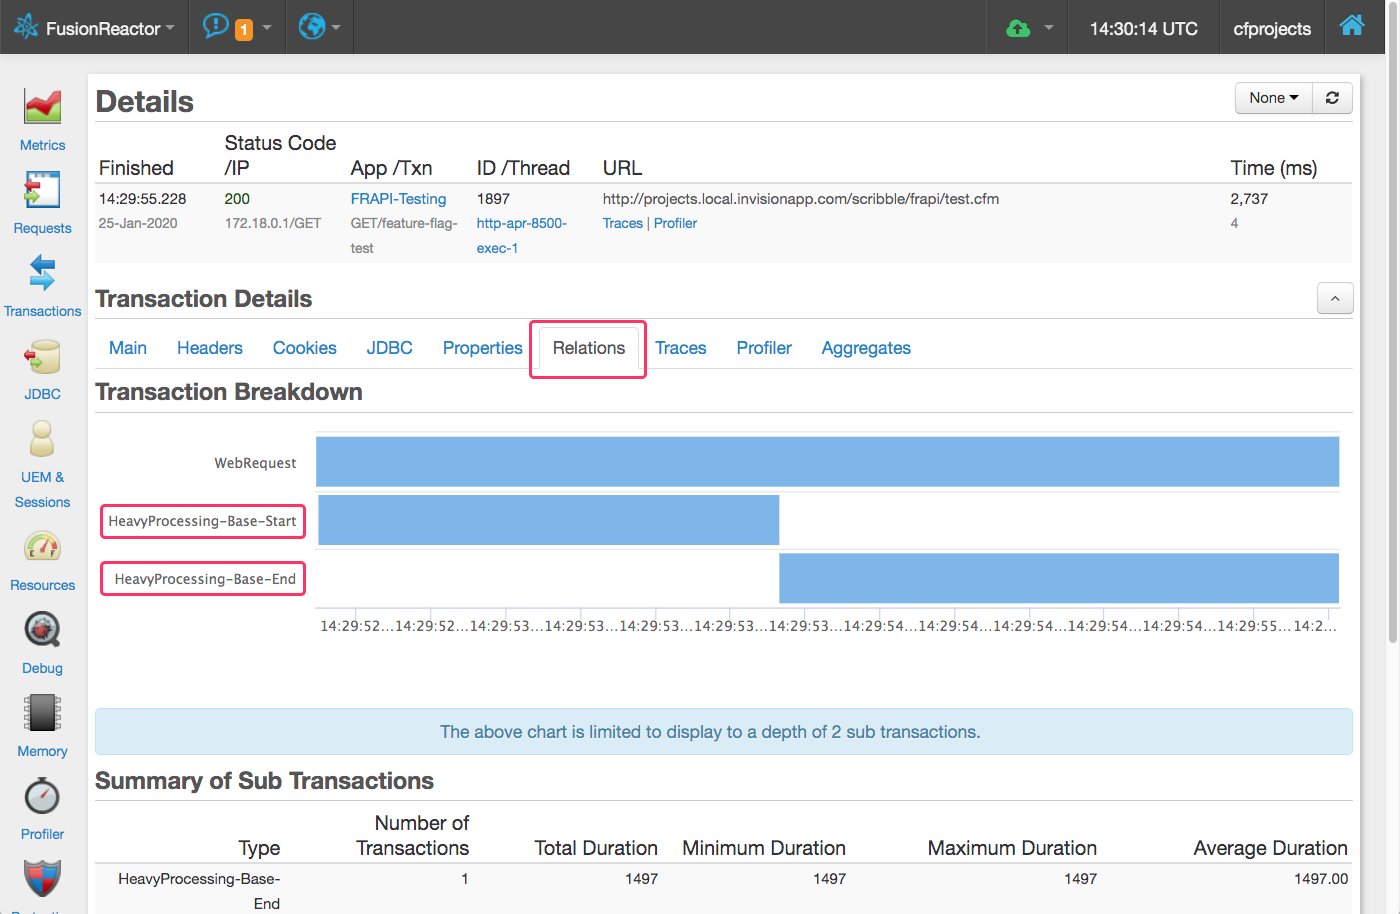
As you can see, the relative execution times of each sub-transaction is visible under the overall execution time of the parent transaction / request.
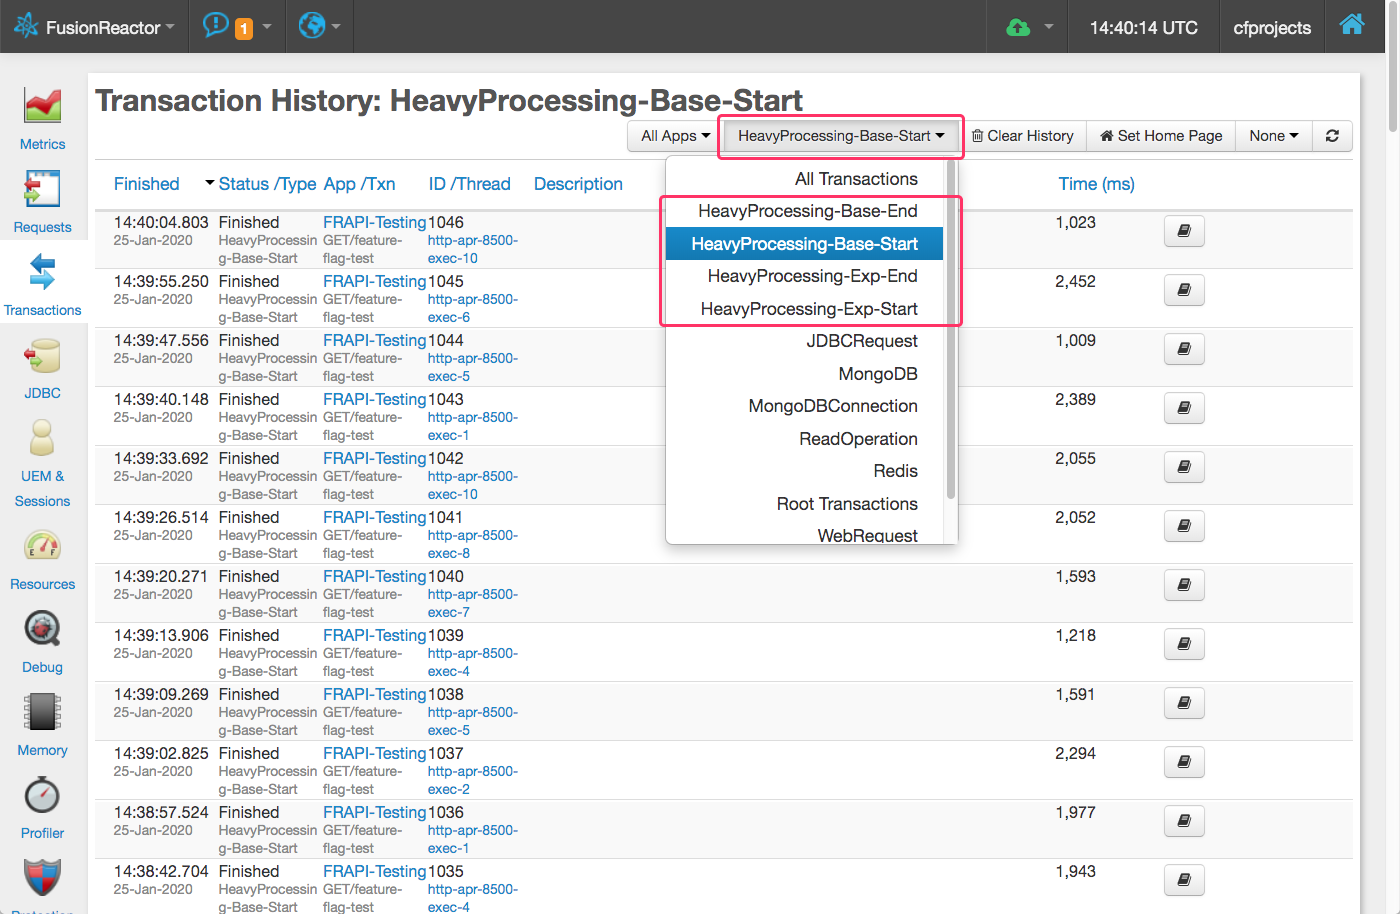
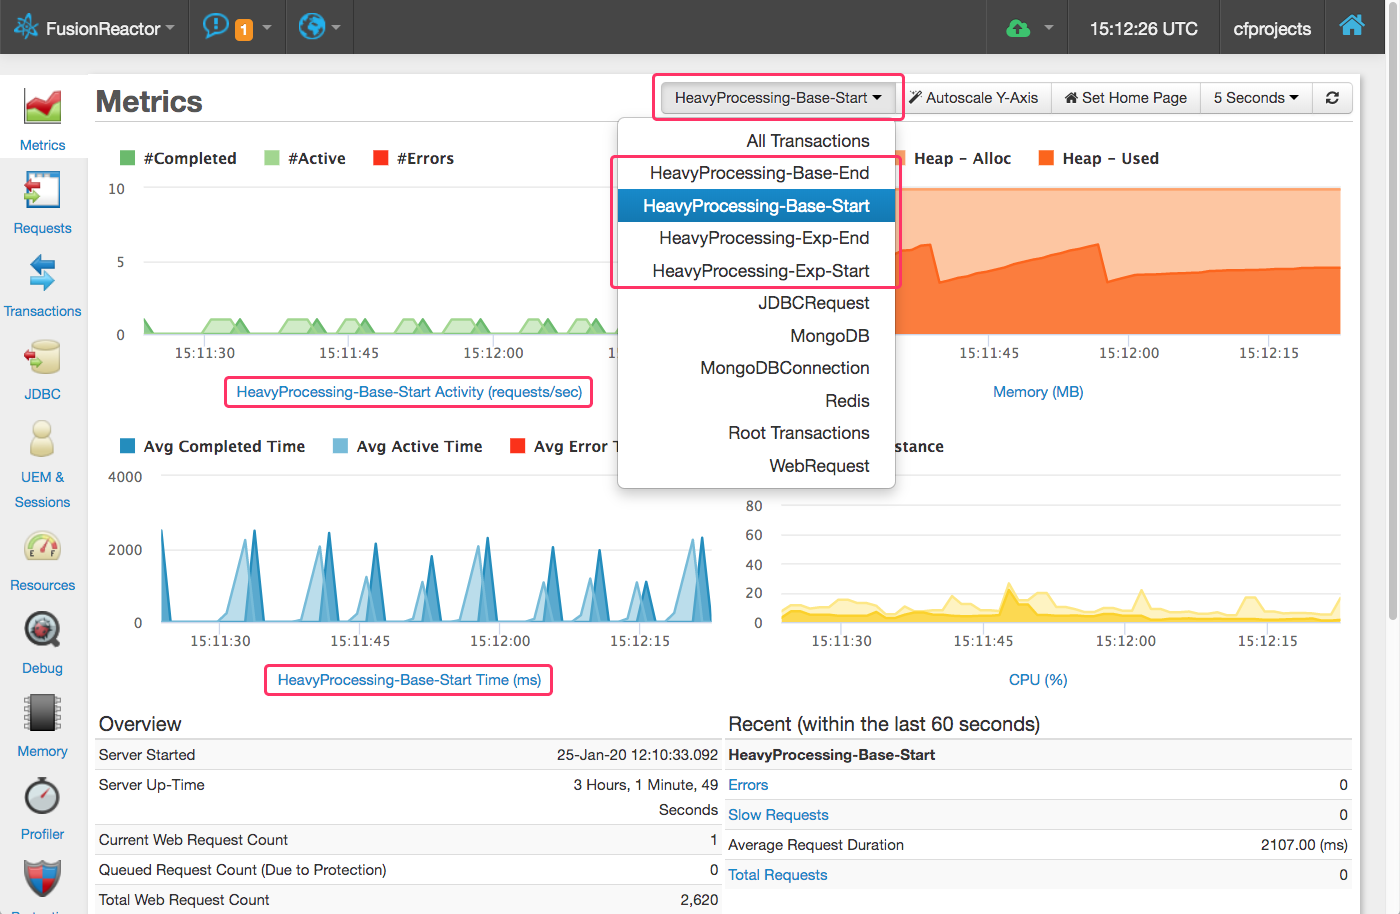
Sub-transaction can also be viewed on their own, independently of any parent transaction, in the Transactions section of the Standalone dashboard via the "Transactions" dropdown:
In the Cloud dashboard, this same data is available in the "Tracing" tab of a given Transaction:
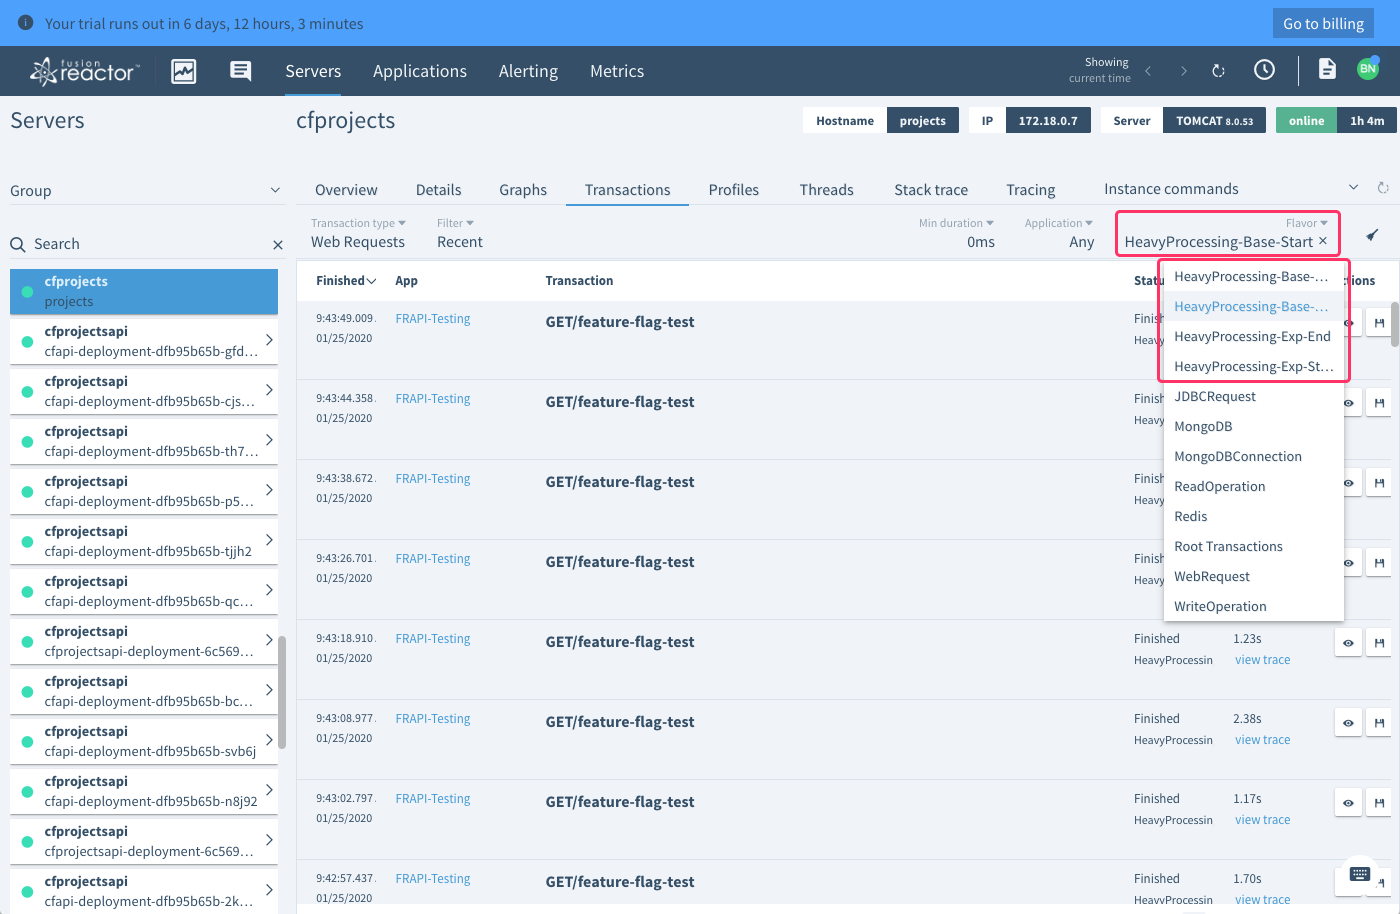
Or, to view them on their own, independent of any parent request, you can select them in the "Flavor" dropdown on the Transactions tab:
I ran into a lot of trouble when naming my sub-transactions. It looks as if including any kind of "path style" notation in the transaction name creates some unexpected behaviors in the dashboard. For example:
/my/transaction/namemy.transaction.name
Using either a / or a . in the name seemed to cause unexpected rendering in the dashboard that I couldn't understand. Maybe this has something to do with the "flavors" that can be associated with the Transactions? I'm not sure. Furthermore, the behavior seemed to be a bit different in the Standalone dashboard vs. the Cloud dashboard.
For now, I'm just going to stick with non-pathed Transaction names.
One of the really cool features of the Standalone dashboard is that these sub-transactions can be easily graphed right alongside the JVM's Heap and CPU graphs.
I could not figure out how to create the same side-by-side comparison in the Cloud dashboard. I suspect that it would require creating a Custom graph; but, I couldn't figure out how to find those transactions in the graph queries.
FRAPI.postNumericAggregateMetric() Method
In addition to segmenting my code with nested Transactions, I can also use various "metric" methods on the FRAPI to track arbitrary timing data. In this case, I'm using the generic "numeric" method; but, there are several methods that help ensure the appropriate data-type is stored:
postMetric()postNumericAggregateMetric()postNumericAggregateMetricFloat()postNumericAggregateMetricLong()postNumericAggregateMetrics()postNumericMetric()postNumericMetricFloat()postNumericMetricLong()
The difference between the "vanilla" metric and the "aggregate" metric is that the aggregate metric will give you a roll-up graph (hour, day, week) in addition to the "live" graph. The vanilla metrics, on the other hand, will only give you the "live" graph.
In the Standalone dashboard, these metrics can be seen in the "Custom Series" of the Metrics graphs:
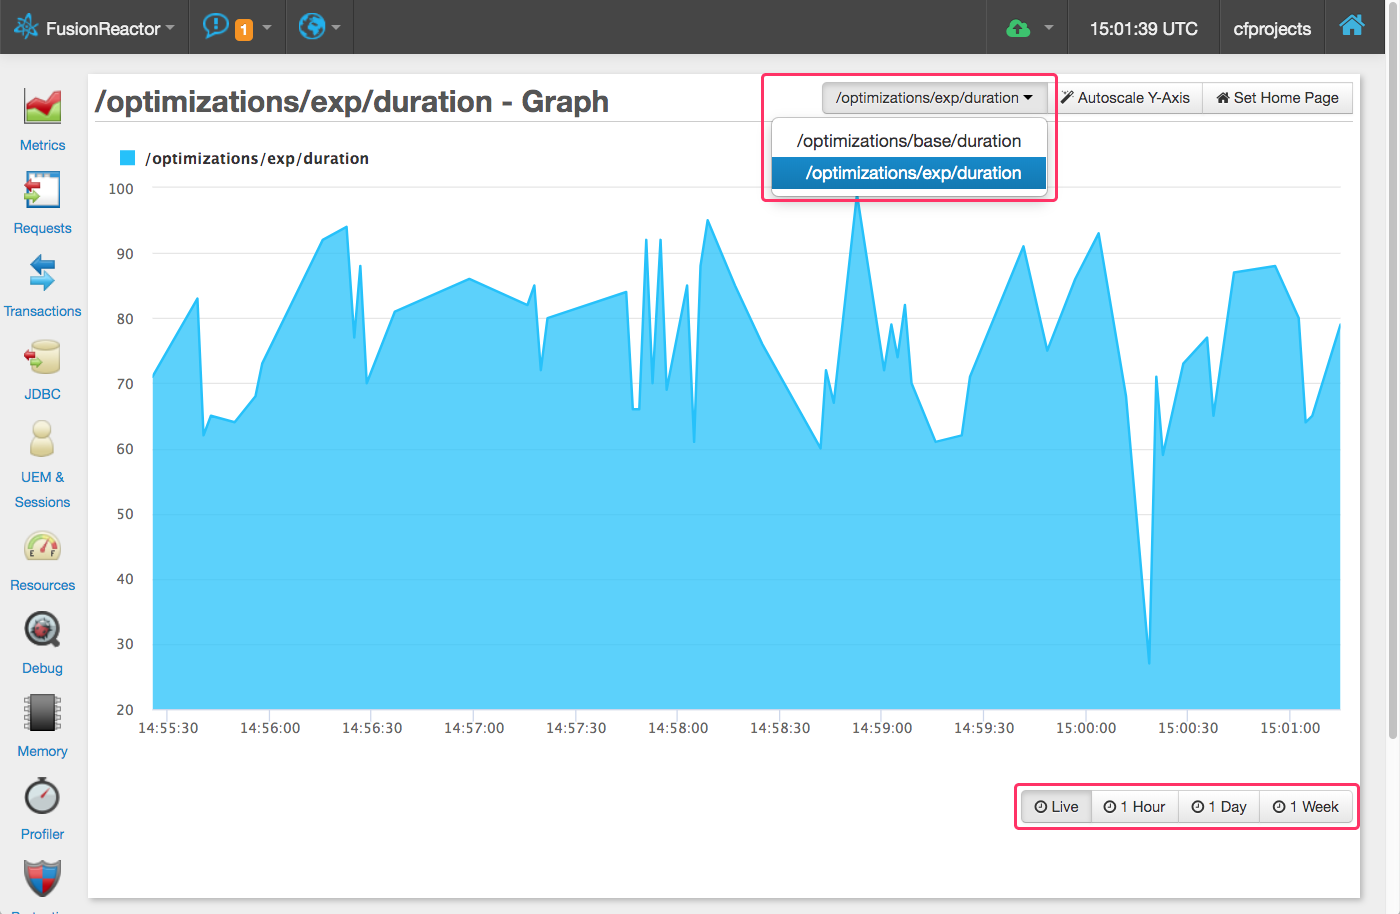
In the Cloud dashboard, it's a bit tricker to get at this data - you have to create a custom graph in the Metrics section:
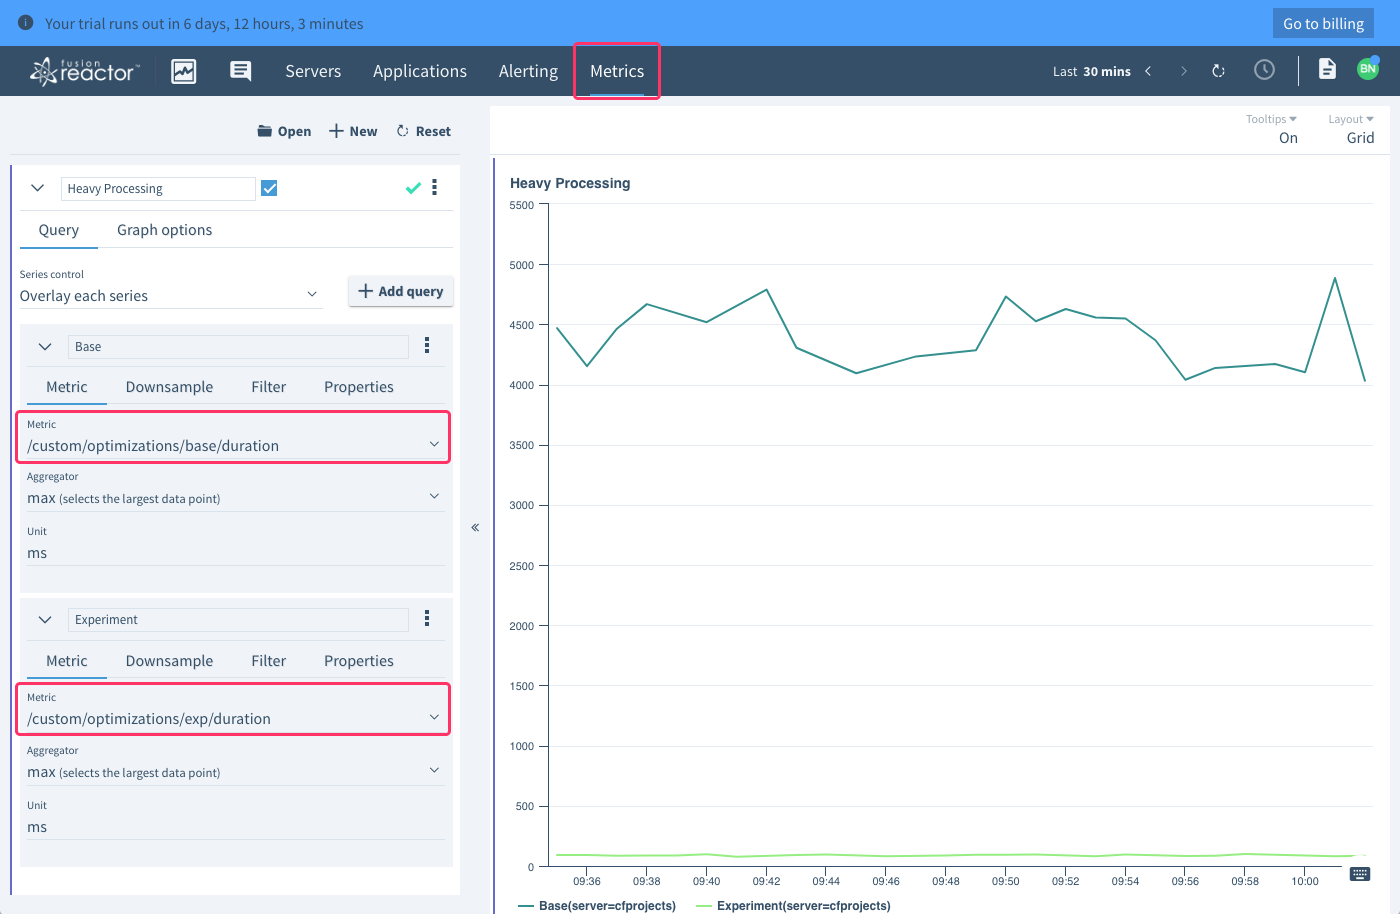
Note that the name of the metric has been automatically prefixed with /custom to differentiate it from other metrics that are implicitly provided by FusionReactor.
Only "aggregate numeric" metrics can be streamed to the Cloud dashboard. And, to do so, you have to explicitly call .enableCloudMetric() to target a specific metric name for Cloud consumption.
Hopefully I didn't get any of this wildly wrong. I am still trying to get a grip on FusionReactor's Cloud dashboard - it's got a lot of the same functionality, but feels very different than the older Standalone dashboard. And, the whole "custom graph" thing is a bit confusing as well, especially when it comes to adding those graphs to the Graphs tab. In fact, it looks as if the custom graphs can't keep up with the "Live" view of the Cloud dashboard.
But, this little exploration should get be far enough into the custom instrumentation that I can do with FusionReactor's FRAPI object in Lucee CFML 5.2.9.40. If anyone else has any tips on what they can do, I'd love to hear it.
Want to use code from this post? Check out the license.

Reader Comments
@All,
In all of the code above, I'm referring to the
FRAPIdirectly. Which is fine as long as you always have FusionReactor's Java Agent installed. However, at work, this inclusion is driven by the Docker's_JAVA_OPTIONSENV value. As such, the code can't necessarily depend on FusionReactor being installed. Therefore, to make the code safer, I tend to wrap theFRAPIcode in a ColdFusion component:www.bennadel.com/blog/3761-wrapping-the-fusionreactor-api-frapi-for-safe-consumption-in-lucee-cfml-5-2-9-40.htm
This limits the functionality that can be used; but, it simplifies the consumption and makes it consistent even if the FusionReactor isn't installed.
@All,
I just added this as a comment in my other
FRAPIpost: www.bennadel.com/blog/3761-wrapping-the-fusionreactor-api-frapi-for-safe-consumption-in-lucee-cfml-5-2-9-40.htm... but, I'll mention it here as well. Apparently, if the underlying FusionReactor instance isn't ready yet, calls to
FRAPI.getInstance()will returnnull. As such, you have to wait until the.getInstance()call returns non-null value before you can start using other methods like.createTrackedTransaction().@All,
As a fun experiment with instrumentation, I wanted to see if I could dynamically wrap all methods of a ColdFusion component in "tracked transactions":
www.bennadel.com/blog/3769-dynamically-instrumenting-coldfusion-component-methods-with-fusionreactor-tracked-transactions-in-lucee-cfml-5-2-9-40.htm
Because ColdFusion is so intensely dynamic, it turns out this is kind of simple (in a complex sort of way).
@All,
I love how I can create "tracked transactions" to instrument segments of my code. However, I have been wanting more clarity on why a segment of code is performing the way it is. I think I can leverage / co-opt the description property of a transaction to get that insight:
www.bennadel.com/blog/3772-adding-a-description-to-fusionreactor-tracked-transactions-in-lucee-cfml-5-2-9-40.htm
Now, I can do things like provide "Inputs" insight to see how those inputs may affect the performance of those segments.
@All,
As I've been digging through the FusionReactor dashboards, one thing I've noticed is that my
CFThreadcode doesn't seem to get instrumented anywhere. Yes, I can get full "stack traces", and theCFThreadsshow up in that. But, they don't really show up in a meaningful way -- at least, not that I can find.As such, I wanted to experiment with wrapping
CFThreadexecution logic in a Tracked Transaction:www.bennadel.com/blog/3773-experiment-wrapping-cfthread-execution-in-a-fusionreactor-tracked-transaction-in-lucee-cfml-5-2-9-40.htm
This experiment works by proxing the
CFThreadtag and then using a callback to invoke the asynchronous logic within an explicit Transaction. This gets the asynchronous code to show up in the general Transactions list in the FusionReactor dashboard.Though, to be clear, I have not tested this experiment in production yet.
@All,
I just used these metric tracking to instrument cache hits and cache misses on my blog:
www.bennadel.com/blog/4250-instrumenting-cache-hits-and-misses-with-fusionreactor-metrics-in-coldfusion-2021.htm
As part of this, I had to refactor away from inheritance and to composition. Just a good lesson to learn (over and over again).
I finally got around to testing what happens if you started a tracked transaction and never close it (explicitly). Example:
Based on what I'm seeing, FusionReactor will just implicitly close the segments when the overall request completes. I was a little worried it would hold-open the request; but that doesn't seem to be the case. Phew!