A Months-Long Journey Of Incrementally Increasing Performance Of A Lucee CFML 5.2.9.40 Service
The last two-and-a-half months of my life have been bananas! They've also held some of the most rewarding work that I've done in a some time. Along with the support from a few of my fellow InVisioneers, I've been working tirelessly to try and improve the performance of a long-neglected internal API service that is built on Lucee CFML 5.2.9.40. This service has been a pain-point for several years; but, has grown increasingly ornery in the last year or so as the demand on it has continued to accelerate. Finally, it got to a point where I had to take a stand; it was time to stop doing "product work" and start focusing on performance and reliability. What follows is my attempt to recount the ups-and-downs of this journey.
The Dumpster Fire
The unfortunate reality of life is that there are only so many hours in the day. And, while there may be glaring problems competing for your attention, those problems can't always be prioritized. That is, until, they get so bad that you are forced to pivot your work and focus on putting out fires.
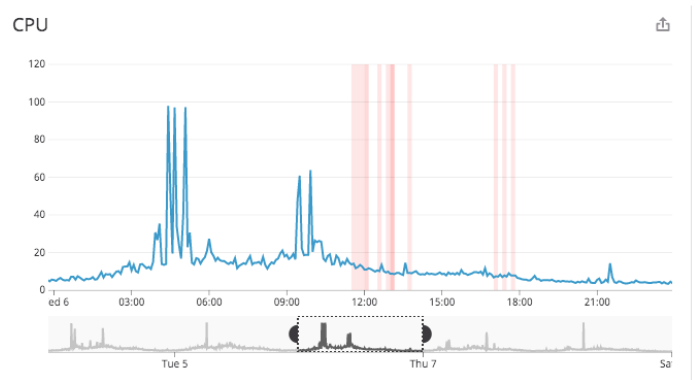
And so it was that on Nov 6, 2019, I created an incident Slack channel dedicated to the performance of this service so that I could start to paint a picture of the problem with graphs and emoticons:
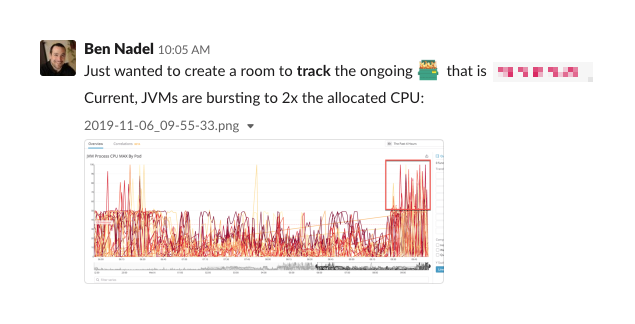
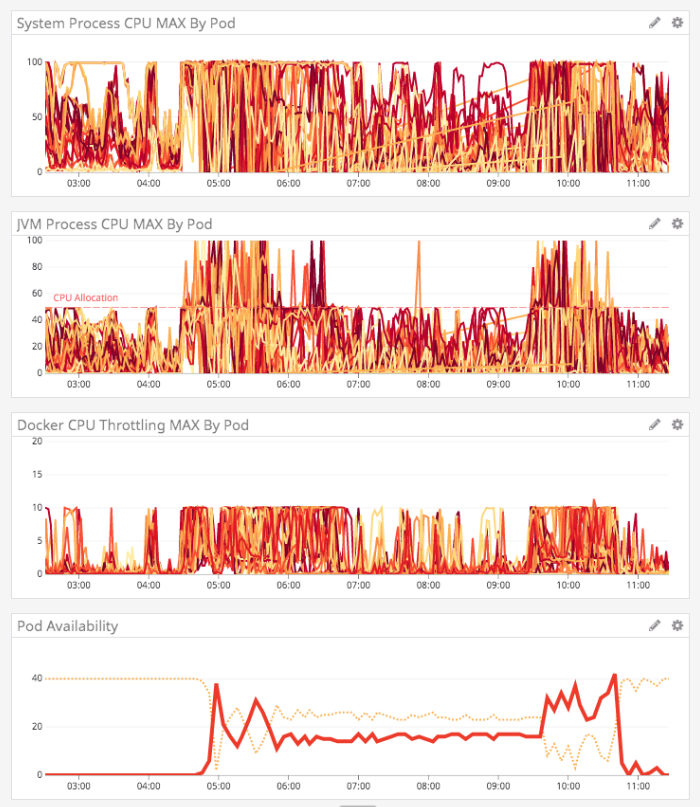
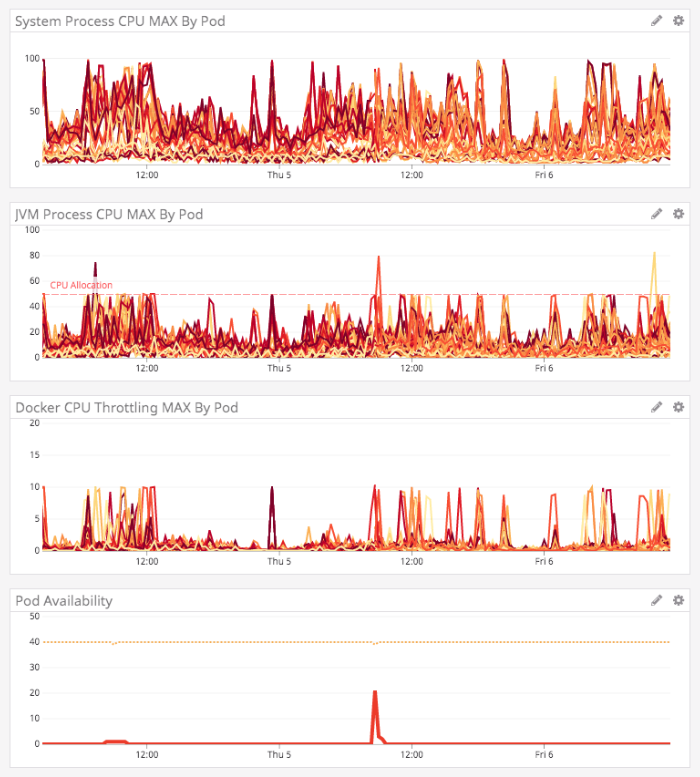
At the time I did this, the service was terribly unstable. It couldn't handle the load it was being given, which was causing Kubernetes (K8) to fail pods out of rotation. Which, of course, meant the remaining pods received even more traffic, which only served to compound the problem. The CPU, throttling, and availability graphs looked like something out of a nightmare at this time:
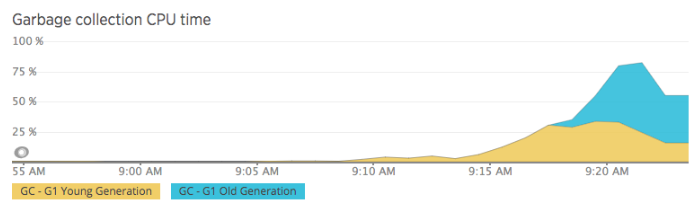
The Lucee CFML service was also doing a lot of Young and Old generation garbage collection, which could take as much as 75% of the CPU time, which essentially rendered any given pod unresponsive for several minutes:
At this time, other InVision teams were also complaining that their downstream services had failing requests because they were making calls to this service.
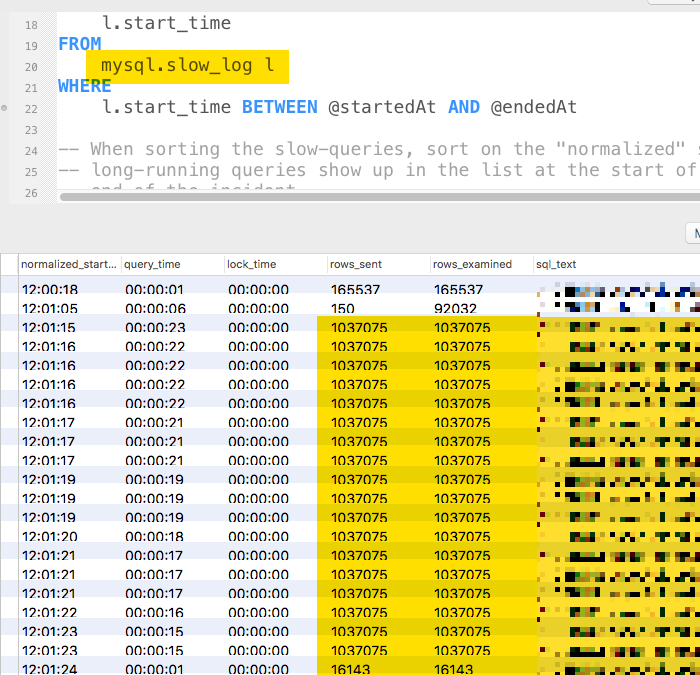
We were also seeing one of the Database CPUs intermittently spiking to 100%. And, because this is part of a legacy system, this database was an integration database. Meaning, it was being consumed by multiple services. So, as this service put increased demand on the database, other services would suffer in terms of query performance.
These database CPU spikes were believed to be caused by SQL queries that were, at times, pulling back more than 1-million records:
In short, this service was a complete dumpster fire.
Getting Insights From New Relic And NRQL
At the time, we had the New Relic Java agent installed on these Lucee CFML servers. New Relic is good about reporting database query times and external HTTP calls (such as pushing files up to Amazon S3); but, unfortunately, it views ColdFusion as a bit of a blackbox. ColdFusion might be built on top of Java; but, it's not Java. Which means, we can't just drop into the code add "Tracing annotations". This results in Transaction traces that leave much to the imagination:
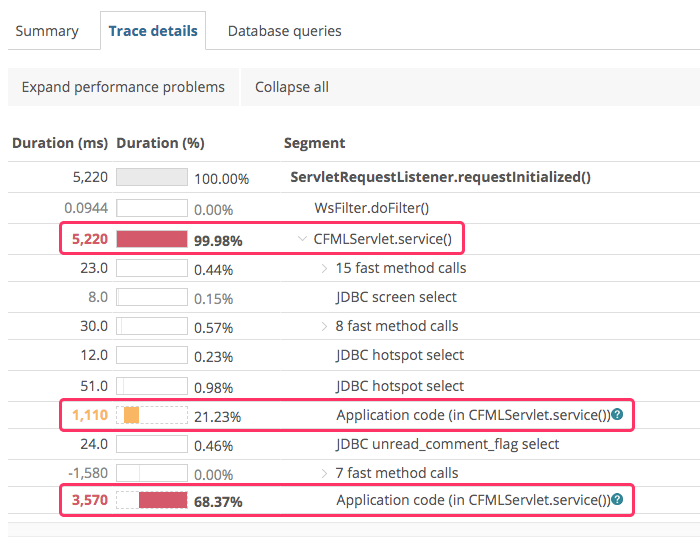
We can see that a lot of time is being used by the CFML code; but, there's absolutely no clarity on what portions of the CFML code are creating the performance bottleneck.
What we can see clearly in New Relic is which ColdFusion end-points are being called and the relative amount of time these end-points are taking and what database calls these end-points are performing. At the time, there were two end-points in our Lucee CFML service that represented a vast majority of the incoming traffic and transaction time. Of these two, I decided to focus on the one end-point with the highest throughput.
The first thing I did was go into the code for this end-point and add a ton of custom instrumentation using New Relic's Java Agent API. This included a lot of code-execution-timing parameters and query record counts.
Then, I created a custom New Relic Insights dashboard using New Relic's Query Language (NRQL). NRQL, by the way, is probably my favorite aspect of New Relic's APM (Application Performance Monitoring) tools. With my NRQL graphs, I was able to get a sense of the sheer magnitude of the problems.
One thing we saw in the NRQL graphs was just how absurd some of the SQL queries were. We were finding that a single user could, over the course of an hour, read hundreds of millions of records into memory:
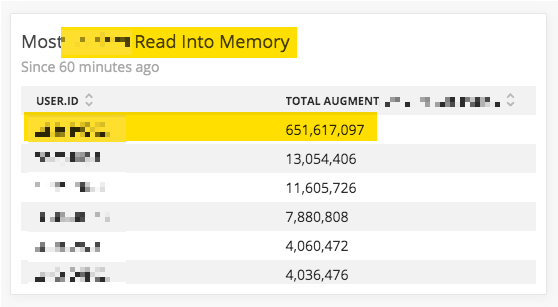
This particular query - or set of related queries - felt like a good place to start ripping code apart.
Replacing One Massive SQL Query With Many Smaller SQL Queries
Now that I had a ColdFusion end-point to examine and a database table to target, I started at the Controller and began walking down the method execution paths. What I found was an algorithm that used a single query to load in all of the records associated with a given user. These records were then consumed during the rest of the request.
When this code was first authored, this was probably a legitimate approach. There wasn't that much data; so, pulling all of the records (for a given user) into memory didn't really throw up any red flags. As the related feature gained traction, however, the performance of this code had clearly gotten worse and worse.
As I began to dig into the data and how it was being used, I noticed that only a portion of the records were relevant to the current request. Unfortunately, at the onset of the request, it wasn't clear which records were going to be relevant - this could only be discovered as the request processing unfolded.
Because each request only needed a subset of the data, I theorized that I could replace the one massive query with many smaller queries that would load data on-demand rather than ahead-of-time. Yes, it meant more trips to the database and more network latency; but, the hope was that this cost would be heavily outweighed by the cost of the massive query.
Of course, I wouldn't just willy-nilly make such a change. So, I created a feature flag to branch this portion of the code. Then, I added a custom New Relic Transaction parameters to track the experimental performance.
What I found was that the "worst-case" performance was just as bad as the base case. Meaning, when most of the database records were needed, many smaller queries were just as slow as the one massive query (if not even a bit slower). However, the worst-case scenario turned out to represent a minority of requests. And, in most cases, making even a large number of smaller, on-demand queries was much faster than making the one large query that pulled back more data than was needed.
At that point, I committed to the experiment and removed the one-large query code. This immediately reduced some load on the database and on the memory pressure within the Lucee CFML pods.
ASIDE: And, of course, I deleted the feature flag. Always remember to clean up your feature flags! Unless they are "operational" feature flags, they should be short-lived and removed from the code as soon as possible.
I also added some in-request caching that removed the need to re-query records that were needed more than once in the same request. This really minimized the number of on-demand SQL queries that I had to execute.
Creating Specialized SQL Queries For Specialized Use-Cases
After I reduced the number of database records that the algorithm was pulling back into memory, I started to look at the underlying data that was being read-in and how that data was actually being consumed. And, what I discovered was that, of each record being read into the Lucee CFML application, only a few of the columns were being consumed.
This is a pattern that I see a lot in code: reading in too much data. I believe this stems from a misunderstanding of the DRY (Don't Repeat Yourself) principle; and a misunderstanding of the Repository pattern. I used to think this way as well - trying not to create one-off queries if I could avoid it. But, these days, I view that as an arbitrary constraint; and, I frequently exercise the freedom to create all the dang queries that I need to get the job done.
So, I went into the various Gateway / Data Access Objects, and I created a handful of SQL queries that were used specifically for this algorithm. These queries pulled back only the columns that were actually needed for this process. And, in fact, with this paring-down, at least one of the queries was now completely covered by a database index. Which meant, it was gonna be hella fast.
ASIDE: Database index design is one of the most important skills you can learn. Check out my blog post on the not-so-dark art of design database indexes.
The Half-Way Point - One Month Of Work
With these new query patterns in place, the dumpster fire that was this service was starting to look more like a small garbage fire. The CPU was still being over-utilized; but, at least the pods seemed to be staying in rotation:
At this time, even the downstream services stopped complaining about service outages and request failures. I thought maybe we were starting to see the light at the end of the tunnel.
That is, until one morning, the usage pattern on this Lucee CFML service completely changed. For reasons that I still don't understand, the Old Generation garbage collection kicked into high-gear and started wrecking the JVM availability:
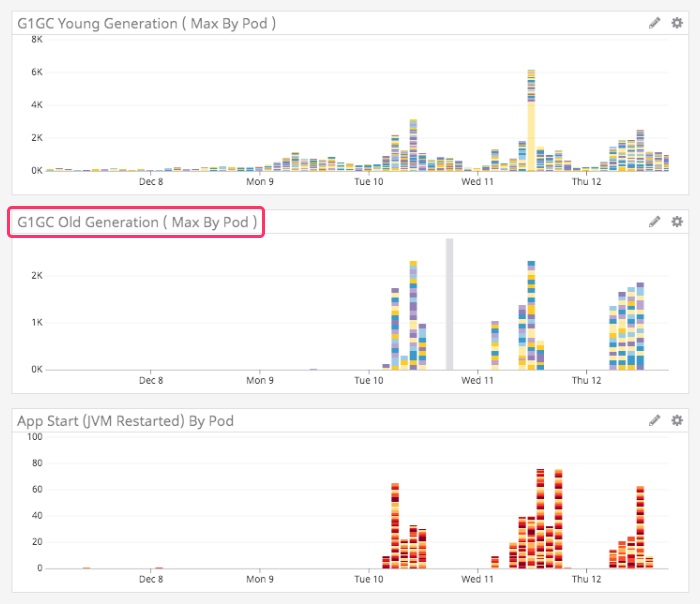
Historically, this service had almost no Old Generation GC activity; even when it was in full-on dumpster fire mode, it was still mostly Young Generation GC. I have no idea what changed. There had been no code changes around that time; and, apparently no changes in the consuming services.
This new pattern clearly followed the European work day. Meaning, the spikes would begin around 4AM EST; and then, taper off around 1PM EST. It had to be based on some sort of user-interaction. But, we just had no idea.
Reverting All My Code For The Last Month
And, of course, when things blow up, you have to believe that it is related to the code changes you've made. Even if you heart-of-hearts tells you that it isn't, you still have to do your due diligence and roll-back your code. Except, I had deployed at least 20-or-30 times in the course of this investigation; so, I couldn't just roll-back. Instead, I had to create a Pull Request that reverted every single one of my commits in the last 30-days.
With the revert in place, I just sat and waited and watched the graphs. And, unfortunately - or, fortunately for my code - the same pattern emerged the next morning. This new problem wasn't code related!
So, re-reverted my code and brought the Lucee CFML service back to date.
Switching From Amazon AWS Spot Instances To Dedicated Instances
One theory that the Platform team had about the unexpected pattern change was that we were losing our bids on Amazon AWS Spot Instances. This was causing pods to drop out of rotation (as the hosts were being de-provisioned), which was putting a lot of load on the remaining pods. And, even though Kubernetes (K8) was trying to provision new pods in response, it just couldn't get them up fast enough.
As such, we tried reducing the ratio of Spot Instances to Dedicated Instances. This seemed to help a bit; but, we were still seeing a lot of Old Generation garbage collection which was locking up the JVMs.
Splitting The Lucee CFML Service Into Two Deployment Groups
This Lucee CFML application primarily services two different consumers. These two consumers use some of the same end-points; but, only one of them hits the end-point that we were actively investigating. As such, we hatched a plan to take the application and split it up into two deployment groups.
By doing this, we would essentially be deploying the same code to two sets of servers. Then, each of the two primary consumers would hit an isolated set of application servers. The hope here being that it would, at least, shed light on which consumer might be causing the issue (and possible expose an unexpected "noisy neighbor" problem).
Unfortunately, doing this did nothing but indicate that we were already investigating the right end-point. The set of servers that weren't hitting this end-point were operating smoothly; and, the set of servers that were hitting this end-point were continuing to catch on fire.
Tweaking The Garbage Collection
After we re-confirmed that we were looking at the right end-point, the Platform team came in and tried to help us tweak the Garbage Collection settings for the Lucee CFML servers. I don't understand thing-one about GC settings; so, it's all magic to me. Some changes were made and we did see some improvement in the performance of the application. But, we were still getting massive spikes that would lock up the machines.
Attempting To Add jmap To The Application.
Tweaking garbage collection only gets you so far - at some point, you just have to stop using so much memory (ancient Chinese proverb). Unfortunately, I didn't have any real insight into what was in the JVM heap allocation. New Relic was showing us how much memory was being used; but, it couldn't offer us any insight into what type of data was in there.
Now, as a product engineer, I don't actually have any access to the production servers. I can't even target a specific server from the URL. So, any introspection of the servers has to be done programmatically from within the application and then graphed in a way that can be evaluated.
I tried to install New Relic's Class Histogram extension, that would use jmap to graph the data-types in the Insights product. However, whenever I activated it, it would block on the jps call and prevent the ColdFusion application from booting.
ASIDE: I reached out to New Relic support who informed me that the Class Histogram was a beta feature and was not being supported outside of the user forums.
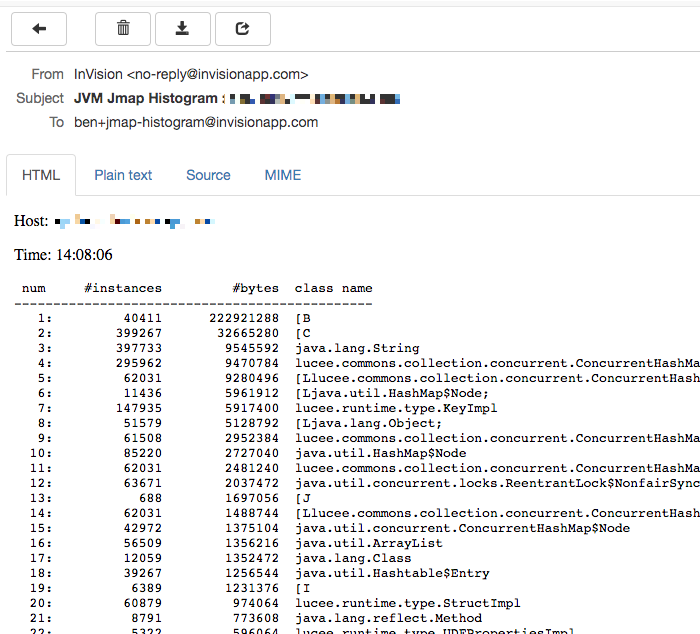
I attempted to integrate jps and jmap directly into the health-probe of the Lucee CFML server. And, locally, I even got it working where I could use a feature flag to turn on a histogram dump that would email me the memory allocation:
Unfortunately, while this worked locally, when the code was in production it was running into some sort of permissions issue:
162: Unable to open socket file: target process not responding or HotSpot VM not loaded. The -F option can be used when the target process is not responding.
I don't understand what this issue was. After all, we are using Docker containers. Doesn't that mean that if it works locally it will also work in production?
Unable to get past this, I abandoned the jmap route.
Upgrading Lucee CFML From 5.2.9.40 To 5.3.3.62
One thought we had was that upgrading the Lucee CFML engine might just solve the problem. After all, the Lucee team is always aggressively investigating performance issues and regressions. So, there was a chance that upgrading to the next dot-release would bring with it implicit improvements.
Unfortunately, after the upgrade to Lucee 5.3.6.62, we started seeing some new image-processing errors and had to roll-back:
Can't cast Object type [Struct] to a value of type [image]
Java type of the object is org.lucee.extension.image.Image
I'm still eager to upgrade; but, that's a task for another time.
Creating Seamless Interactions With MongoDB
Without being able to use jmap to peer into the memory allocation, all I had at my disposal was to look at the code and try to find places that might be allocating - or churning - unnecessary memory. The first possibility I found was old code that interacted with MongoDB.
When this code was first written, it was coded on top of Adobe ColdFusion 10. Historically, Adobe ColdFusion has had horrible support for JSON (due to the underlying data structures). Which means that, historically, interacting with MongoDB has been a bit of a nightmare. As such, the CFML code was littered with all this intermediary stringification and parsing:
MongoUtil.parse( serializeJson( value ) )
This was serializing the data simply so that it could be passed to the MongoDB Java Driver, which would subsequently parse it so that it could then subsequently be serialized back into the MongoDB collection. Furthermore, it was using a really old version of my JSON serializer, which was injecting and replacing chr(2) in order to ensure that "numeric strings" remained "strings" during the serialization process.
Oh my chickens! That's some crazy sauce right there.
Now that this ColdFusion code is running on Lucee CFML 5.2.9.40, it means that we have "true" data structures; and, we have ordered structs, which are perfect for generating BSON documents in MongoDB. As such, none of the aforementioned challenges were still relevant.
I went through the code (in this end-point) and replaced all of the crazy string manipulation with vanilla calls to create BSON documents:
createObject( "java", "com.mongodb.BasicDBObject" ).init( data )
I have no doubt that this helped reduce the memory pressure; and, increased the speed of the algorithm.
Removing All The Recursion
Another thing that I saw in this code was a ton of recursion. The end-point was processing a giant data-structure that was arbitrarily hierarchical in nature. And, in order to process the data, each node would recursively explore its child nodes.
Because I knew that some of the data payloads posted to this end-point were huge (thanks to the instrumentation that I added), I suspected that trying to recurse over this structure might allocate a ton of memory (what with deep call-stacks and arguments scoped and what not). As such, I went through and I replaced all of the recursion with while loops. This way, the call-stack was only one-level deep and the set of allocated variables was clear and bounded.
I also think it simplified the code greatly; though, opinions on this may vary (cough, Brad Wood, cough).
Getting Close To Good
With all of the above changes in place, this Lucee CFML service was actually starting to look really good!
The System CPU wasn't being pegged constantly; the JVM CPU was looking less angry; and, heck, the pods were generally staying in rotation. We were still getting pretty big CPU spikes that we didn't understand; but, our downstream consumers were significantly more pleased with the service uptime.
Installing FusionReactor Cloud
After continually feeling like we just weren't getting what we needed from New Relic, we decided to install FusionReactor, an APM (Application Performance Monitor) that offers tight integrations with ColdFusion servers. I've used FusionReactor in the past with much success, and was very excited to see what it would show us.
One of the super powerful features of FusionReactor is that it will automatically start sampling long-running requests; which means, you can look at those requests after-the-fact and see where, in the code, the request was spending the most time.
This showed us something very unusual. We were seeing long-running request - requests taking over 1,000-seconds - stuck on one line of internal Lucee code:
lucee.commons.net.URLDecoder.decode(URLDecoder.java:65)
What's more, this blocking line of code appeared in two distinct places. First, at the very start of a request before anything else had been processed:
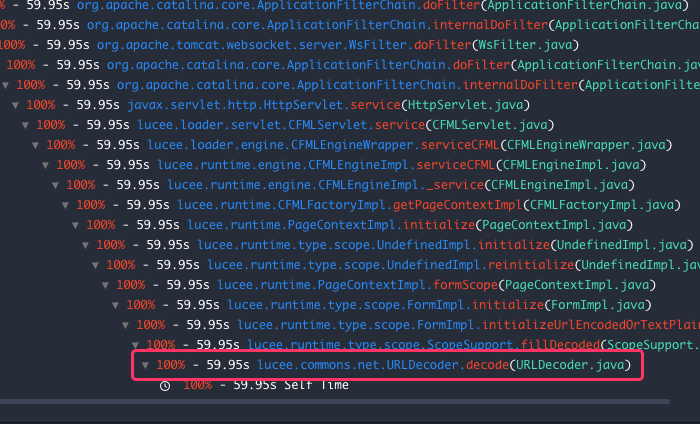
And then, just after spawning a CFThread tag body:
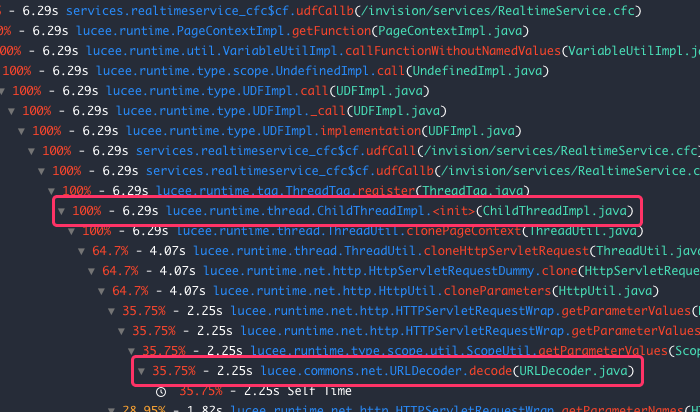
Seeing a URL decoding line at the onset of a request makes sense. But, seeing this as part of a CFThread spawning process was confusing.
After doing a little experimentation, I discovered that Lucee clones the request context when spawning threads, which can take an absurd amount of time. And, if you dig into the Lucee code on GitHub, it looks like part of the cloning process involves re-parsing the raw requests data.
Upon seeing this, I popped over the Lucee Dev Forum and found a post that showed a similar stack-trace to what I was seeing. After posting a few messages about my experience, Joe Gooch suggested that posting a large JSON payload as a file may be more efficient than posting it as a form field.
I tried taking Joe's advice and refactoring my CFThread spawning demo using a File-upload. And holy frecking chickens, the 90-second latency I was seeing (in my demo) dropped to 90-milliseconds. That's two orders of magnitude faster!
I was so excited about these findings I literally felt nauseous.

Unfortunately, I didn't have control over how the data was being posted to this Lucee CFML service. But, very fortunately, I work with some excellent people who were just as excited to get this service working properly. So, in the space of 2-days after discovering this potential performance improvement, we had both the consumer server and this Lucee CFML service coded to access file-based uploads of the JSON payload.
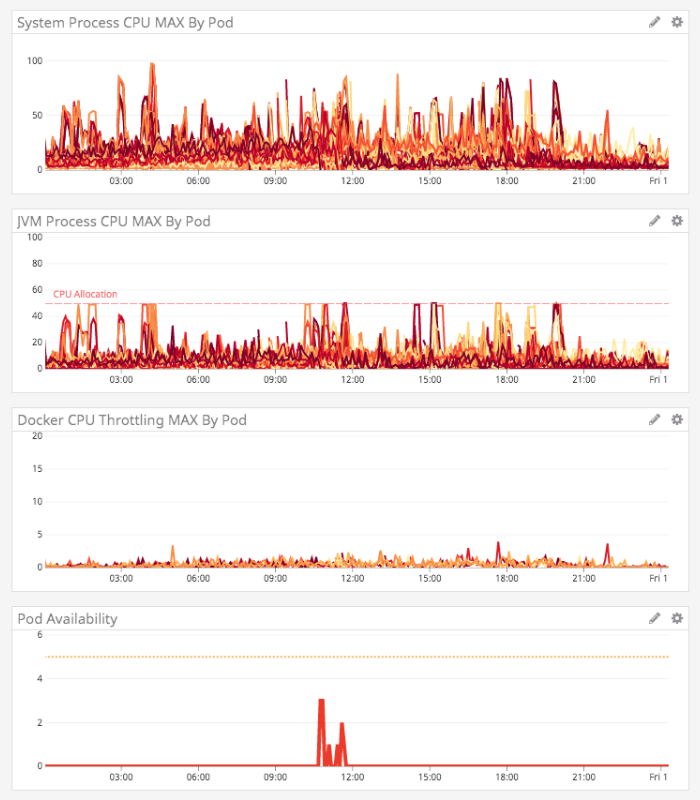
And, after we deployed it, the results were spectacular:
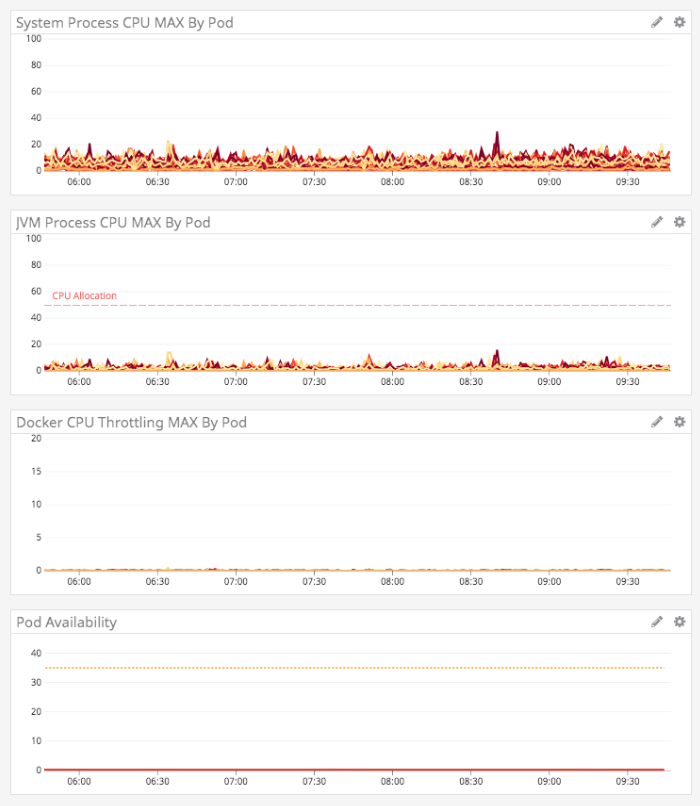
The graphs became whisper quiet. The System and JVM CPUs were beautiful; there was essentially no Docker throttling taking place; the pods were all stable and in rotation; and the garbage collection dropped off dramatically (with zero Old Generation collection taking place).
Did FusionReactor just pay for itself ten-times over? Yeah, I think it did!
It Takes Teamwork To Make The Dream Work
We did it! We took this dumpster fire of a Lucee CFML service and incrementally transformed it into a shining example of performance and stability. I want to give an enthusiastic and grateful shout-out to the InVision people who helped make this odyssey possible:
- David Bainbridge
- Shawn Grigson
- Rich Armstrong
- Hussam Dawood
- Adnan Kobir
- Pablo Fredrikson
- Cory Thomas
I'm sorry if I forgot anyone here - the last couple of months have been a whirlwind!
Not A Single Unit Test Or Linting Tool
I am not saying this is necessarily a "Good Thing"; but this Lucee CFML service is just the next evolution of a seriously legacy service that started 8-years ago on Adobe ColdFusion 8. Every single change that was made to this service in the last 3-months was done without a single unit test or a linting tool.
Most of the time, I was leveraging feature flags to safely deploy code to production which I would then test on myself, teammates, and a limited set of users.
And, in cases where I was particularly nervous about my changes, I was dumping out local database records before and after updates and then diff'ing them in Beyond Compare (one of my all-time favorite tools):
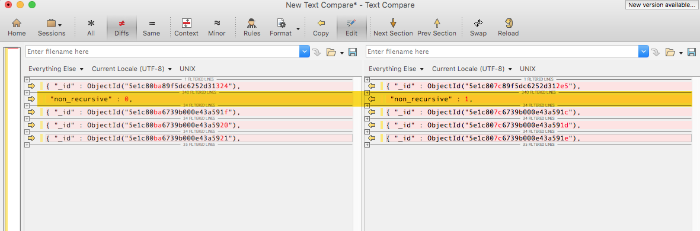
It sounds crazy; but, I've never felt so alive or so intimately aware of how code is being processed and what control-flow is being executed. When I can't rely on tests to prove my changes, I have to rely on my fear to keep me vigilant and true.
You do not fear death. You think this makes you strong. It makes you weak.

Reader Comments
Fantastic write-up, Ben! Thanks for sharing.
And congrats on such an improvement. I know how accomplished that feels and that feeling is my heroin. I jones for it every day.
I was particularly interested in your usage of feature flags. I have some initial thoughts on how I might approach that in my work, but I'm curious how you implemented them. If you can, would you mind sharing a few details? Specifically: How did you indicate a feature flag? (env var?) And how did you cleanly flip between different implementations based on that flag? (refactor the relevant portion into a method and make a competing method?)
One last thought...
This paragraph is something to which we should all be always aspiring. I know I've managed to run into that situation a few times (https://adamtuttle.codes/blog/2020/challenge-breeds-stability/), but it never hurts to have a concrete example showing potentially-naive choices made early on and just how long and far they can take you before you really have to optimize them. So congrats on that part, too.
@Adam,
Thank you for even making it through this entire post :D I'm glad that you enjoyed it.
Feature flags rule everything around me :D At work, we use LaunchDarkly (LD) for our feature flag implementation. It's a bit $$$, but it's super powerful. It provides its own SaaS dashboard in which you can target users based on properties and do percentage-based roll-outs. Then, the LD Java client will stream the feature-flag states in the background. So, when you check a feature-flag value, it's just doing an in-memory check (the in-memory state has all been kept up-to-date in the background by the LD client itself), so there is essentially zero overhead to checking feature flag values.
I've talked about LaunchDarkly and feature-flags a bit in the past; but, I am not sure if I've ever really outlined the end-to-end approach that we use. I think I've mostly just written from a small technical perspective. I think that would make for a good write-up. I will queue that up for some fleshing-out. Great suggestion.
@Adam,
Re: Naive choices. I'll tell you, the older I get, the more likely I am try out a naive choice before I put in the effort to make something really solid. After all, an idea might be good in your head, but then you go to build it and it turns out to be a lot more complicated; or, even worse, you get it done and no one even uses it :D So, sometimes, I'm just like, "Let's get something people can use, and then figure out if we need to make it better later".
Depends on the type of thing I'm building. And how confident I am in the return on investment.
I'll check out the link.
Ben. This is a brilliant write up.
It will definitely come in useful, as the load starts to increase on my servers and I start to see my own bottlenecks. Obviously, the scale of the services, your company provides, is vastly greater than the ones I deal with, but I will bookmark this article for future reference. The SQL part is especially interesting. Every time, I create a query, I now think about the performance impact. 90% of the time, I will refactor queries to take this into account. This is something, I almost never did, 5 years ago!
As an aside, the other day, I noticed that one of my VPS kept crashing. I had a look at the hard drive space available and I noticed, that I only had 4MB of free space. Now, considering, I have 100GB, and the OS takes up about 30GB, and my other software and codebase, an extra 10GB, I couldn't understand where the other 50GB had gone. I then did a bit of digging and found out that my C:\Windows\SoftwareDistribution , had 50GB of updates in it. It was a great feeling, deleting this data and watching my server, working happily again!
So, I understand that feeling of euphoria, when we manage to resolve server performance issues. Obviously, your issues were far more in depth, but a feeling is a feeling:)
@Charles,
Ha ha, 50GB of software updates! That's bananas. I think that happened to me one time. This blog is on "managed hosting", and a while back they updated the Operating System, and I was basically out of space. After poking around, I saw that they had backed-up the old OS into a folder on the hard-drive that was like half of the space :D
I'm glad you found this read worth-while - I know it was a slog to get through. But, on my end, it was thrilling :D
One of the other things, that I have noticed with SQL queries, is that often, columns that aren't required, are returned. This is especially apparent when using a Bean framework [FW1] that returns every single column to populate its model. I now strictly audit, the amount of data that is pulled back from my queries. The other day, I was making an Ajax request, and the response was returning vast amounts of text data, that wasn't actually being used in the front end. I then decided to modify this request by sending a key list of required columns that I wanted returned. Very simple stuff, but the responses became lightning fast. And then, I went one step further and cached the responses in the front end, which meant less API calls.
I often think coding is like creating a sculpture. Start off rough & ready, and then gradually refine & polish. So, I understand your comment about using the naive approach. Creating performance enhancements is extremely satisfying and is something, I find myself concentrating on, nowadays. I guess, this kind of approach, is easier to adopt, as our knowledge of the basic principles, becomes second nature.
RE: operating system backup.
It's amazing how much junk accumulates on our servers:)
Most of it, is put there, without our knowledge.
The machines are quite literally taking over:)
@All,
This post ended on the migration to FusionReactor. And, now that we're on FusionReactor, I wanted to take some time to get familiar with the Java Agent's instrumentation API (
FRAPI):www.bennadel.com/blog/3760-using-the-fusionreactor-api-frapi-to-add-custom-instrumentation-in-lucee-cfml-5-2-9-40.htm
I couldn't find too much documentation on it; so, this is what I was able to piece together from the Java Docs and an old blog-post on the FusionReactor blog.
@Charles,
I love the analogy of creating a piece of sculpture, starting out rough and then gradually refine it! I think that is so spot on! When I was younger, I used to believe that you could immediately get to the polished version if you just planned enough and thought deeply enough about the design. But, now that I'm older, that just feels silly. You can / should still plan; but, nothing ends up the way you think it will - you just got start moving forward with the rough stuff and see where you end up.
@Adam,
So, after our conversation here, I tried to take the last few morning to articulate how I use Feature Flags (and LaunchDarkly) here at work:
www.bennadel.com/blog/3766-my-personal-best-practices-for-using-launchdarkly-feature-flags.htm
.... it's a bit of a read. But, maybe there something meaningful somewhere in my pontification.