
Performance Case Study: Parallel Data Access Using Parallel Struct Iteration In Lucee 5.2.9.40
A couple of weeks ago, I was very excited to discover that Lucee 5 supports parallel iteration of data structures. And, given this parallel iteration, I started exploring the developer ergonomics of asynchronous data accesses using parallel iteration. Once I had a pattern that felt easy enough to use, I immediately set about creating a feature-flagged experiment in production using LaunchDarkly. As I started to divert a percentage of the user traffic to this experiment, the results were a bit surprising - it wasn't the obvious win that I had been hoping for.
For this experiment, I picked an end-point that gets a lot of traffic and performs a lot of data-access. Then, at the Controller level of the ColdFusion web application (using Framework One), I gradually worked-up to diverting 50% of the user traffic to the experimental workflow.
For this experiment, I wanted to look both at the local performance around the parallel data-access and at the macro performance of the overall HTTP Request itself. As such, I used New Relic to tag each Transaction, for this end-point, with an indication of whether or not the request was routed to the experiment. Here's a truncated version of my FW/1 Controller method:
public void function myEndpoint( required struct rc ) {

	// ....

	// EXPERIMENT: This end-point loads a lot of queries, many of which are completely
	// independent of each other. As such, we're going to try running some of the
	// query / processing in parallel threads for improved response times.
	if ( shouldUseParallelAccessExperiment( authenticatedUserID ) ) {

		// Mark Transaction as using the experimental behavior (for New Relic).
		javaAgentHelper.addCustomParameter( "experiment", "parallel" );

		rc.apiResponse.data = myWorkflowExperiment.getData( ..... );
		return;

	}

	// Mark Transaction as using the default behavior (for New Relic).
	javaAgentHelper.addCustomParameter( "experiment", "serial" );

	rc.apiResponse.data = myWorkflow.getData( ..... );

}
As you can see, if the feature flag is enabled for the given user, I route to the experimental version of the Workflow and then short-circuit the Controller method (returning early).
Inside the experimental workflow, I then re-worked a number of queries and processes to be performed using parallel Struct iteration. Here's a truncated version of the workflow - notice that I'm using DataDog to record the overall time of the parallel iteration as well as the local execution time of each parallelized callback:
public struct function getData( .... ) {

	// ....

	var startedAt = getTickCount();

	var parallelResults = runInParallel({
		conversationData: function() {

			return( /* database query. */ );

		},
		dividers: function() {

			return( /* database query. */ );

		},
		projectBackgroundImages: function() {

			return( /* database query. */ );

		},
		projectMemberCount: function() {

			return( /* database query. */ );

		},
		projectOwner: function() {

			return( /* database query. */ );

		},
		projectStatuses: function() {

			return( /* database query. */ );

		},
		screenSketches: function() {

			return( /* database query. */ );

		},
		screenUrlIndex: function() {

			return( /* CPU-bound signed-URL generation. */ );

		},
		templates: function() {

			return( /* database query. */ );

		},
		workflowStatusColorsQuery: function() {

			return( /* database query. */ );

		},
		workflowStatusesQuery: function() {

			return( /* database query. */ );

		}
	});

	// Pluck items out of the parallelized results.
	var conversationData = parallelResults.conversationData;
	var dividers = parallelResults.dividers;
	var projectBackgroundImages = parallelResults.projectBackgroundImages;
	var projectMemberCount = parallelResults.projectMemberCount;
	var projectOwner = parallelResults.projectOwner;
	var projectStatuses = parallelResults.projectStatuses;
	var screenSketches = parallelResults.screenSketches;
	var screenUrlIndex = parallelResults.screenUrlIndex;
	var templates = parallelResults.templates;
	var workflowStatusColorsQuery = parallelResults.workflowStatusColorsQuery;
	var workflowStatusesQuery = parallelResults.workflowStatusesQuery;

	// Record duration of parallel data access.
	recordInsight( "firstRunInParallel", startedAt );

	// ....

}


private struct function runInParallel( required struct items ) {

	var mappedItems = items.map(
		function( taskName, taskOperation ) {

			var startedAt = getTickCount();

			try {

				return( taskOperation() );

			} finally {

				// Record duration of individual parallelized task.
				recordParallelInsight( taskName, startedAt );

			}

		},
		true // Parallel processing for struct keys.
	);

	return( mappedItems );

}
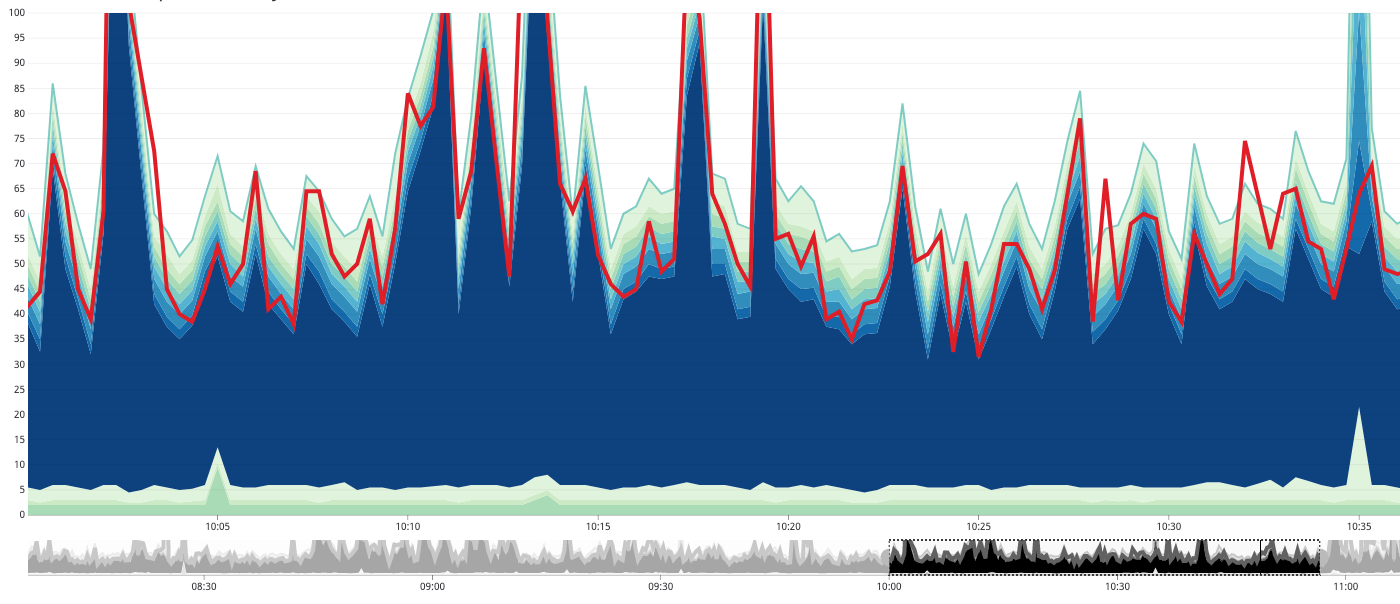
Each of the timing metrics is being recorded in DataDog with a tag so that I can easily graph them as stacked metrics. And, when we look at an ordinary hour of "peak traffic", where 50% of the user-traffic is flowing into this experiment, we get the following breakdown. Note that the red line is the timing of the overall parallel iteration and the stacked area strata are the individual task timing metrics (click for larger image):
NOTE: The metrics are all using
max()aggregation for the time period.
When I look at this graph, I see a few things:
The red line (the overall time) is usually less than the sum of its parts. Which makes sense since the parts are running in parallel. However, there are times in which the red line is greater than the sum of its parts, representing a non-zero cost for the act of parallelization itself.
Most of the tasks in the parallel struct iteration execute really fast. Meaning, less that 5ms.
This set of tasks clearly has one large bottleneck, in terms of timing (the CPU-bound signed-URL generation).
The overall time of the parallel struct iteration will never be faster than the timing of its largest iteration (logically speaking). In this case, that bottleneck represents like 70% (rough estimate) of the potential task execution time.
The fact that most of the tasks take less than 5ms is concerning because Gert Franz calls this out in one of his Lucee presentations:
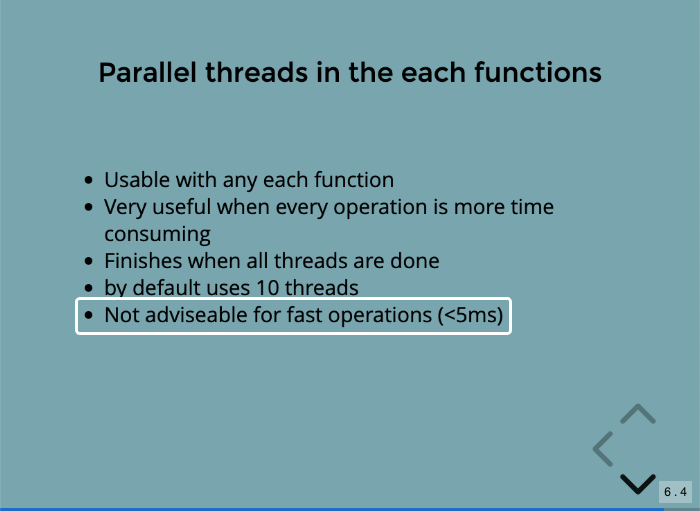
As you can see, Gert explicitly states that parallel iteration should be used for tasks that take more than 5ms. So, already we are seeing that this particular context may not be the best suited for parallelization. This type of iteration is not a cure-all for performance woes.
That said, the red-line clearly indicates that some boost in performance is taking place. Which is what makes the New Relic graphs so frustrating. Remember that I am identifying which New Relic Transactions are going through this experimental workflow. I can then compare the experimental and control response latencies using the following New Relic Query Language (NRQL):
SELECT
	max( duration )
FROM
	Transaction
WHERE
	appName = 'my-app'
AND
	experiment IS NOT NULL
FACET
	experiment
TIMESERIES
In NRQL, the FACET directive is akin to the GROUP BY directive in SQL. And, the TIMESERIES directive tells New Relic to render the result-set as a visual graph rather than a table. When I run this as both the max(duration) and the average(duration), I get the following output (click for larger image):
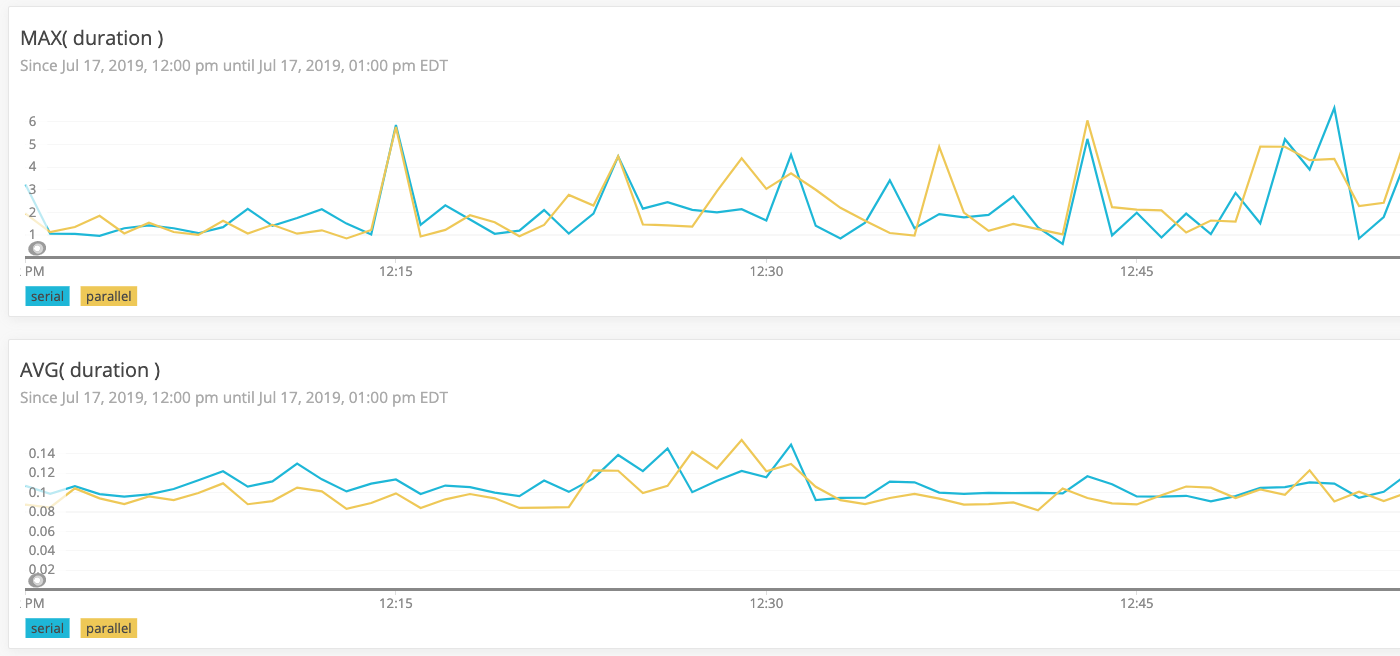
NOTE: This New Relic time period is not exactly the same as the DataDog graphs. I chose a window that had no deployments (which have a non-trivial impact on latency when the new pods are coming online).
On the max end of the duration spectrum, there is no clear winner. Sometimes, the parallel struct iteration leads to a faster response time; but, just as often, it is slower than the control workflow.
On the average end of the duration spectrum, the parallel struct iteration does seem to have a bit of an advantage. Though, again, this is not entirely consistent. Sometimes, the parallel iteration leads to slower times. And, often times, it's just neck-and-neck with the control workflow.
So, there does seem to be some performance benefit to parallelized data-access in this particular context. Though, it's not nearly as large as I was hoping for; and, it does require some additional complexity in the code (though this latter point could be removed if the code was cleaned-up).
Given the fact that the DataDog graphs indicate that the processing for this request has a large bottleneck when generating signed-URLs, I performed an additional experiment to see what would happen if I moved the signed-URL generation to its own parallelized iteration (truncated code):
screens.each(
	function( screen ) {

		screen.imageUrl = /* generate signed-URL. */ ;
		screen.thumbnailUrl = /* generate signed-URL. */ ;

	},
	true, // Parallel iteration.
	4 // Max threads that can be used.
);
In this case, I know that the signed-URL generation is a CPU-bound task; so, I limited the thread-count to 4 - not the default of 10 - in order to match the number of CPU cores in the JVM (as allocated by Kubernetes).
Unfortunately, when I deployed this change, the performance took a huge hit:
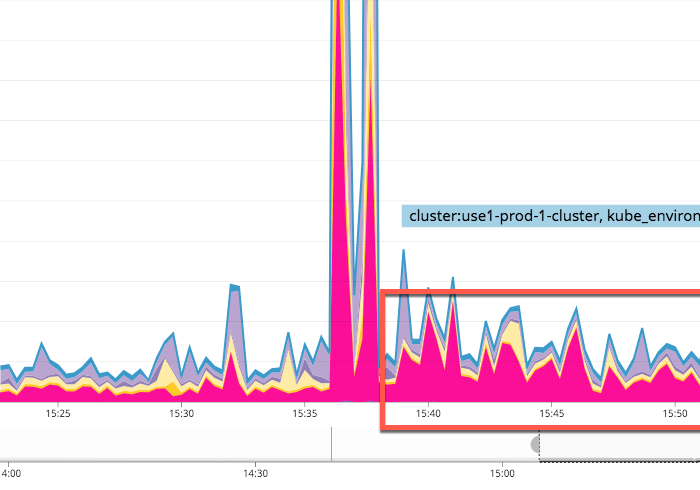
NOTE: For some reason, I couldn't locate this data in DataDog. As such, I had to repurpose an image that I had pasted into Slack.
As you can see, after the deployment (the large spike), the DataDog area stratum representing the signed-URL generation (highlighted in Pink), jumped considerably. Attempting to run the signed-URL tasks in parallel lead to a dramatic decrease in performance. Though, it's unclear why this happened. It could be that:
The parallelization of a CPU-bound task overloaded the CPU.
While the overall signed-URL process is slow, the individual signed-URLs are relatively fast (faster than 5ms), which was outweighed by the cost of the thread-management itself.
Ultimately, I rolled-back this later part of the experiment and am continuing to try and find ways to optimize this request (such as by caching the results of the signed-URL generation in Redis).
When I first discovered the parallel iteration in Lucee, I immediately imagined implementing performance optimizations all over the application. But, from this experiment and case study, I can see that parallelized iteration isn't just a drop-in performance solution. And, in fact, there are times when attempting to parallelize work can lead to a performance decrease.
Performance optimization is a non-trivial, largely iterative task. Some improvements can be achieved through small tweaks; but, many improvements can only be achieved through large refactorings and workflow alterations. The journey continues!
Want to use code from this post? Check out the license.

Reader Comments
Ben, thanks for setting this all out and in particular for mentioning Gert's presentation which I'd missed. It's helped crystallize my understanding:
https://blog.simplicityweb.co.uk/117/using-lucees-simple-parallel-processing-appropriately
@Julian,
Very cool -- two heads is better than one as we try to figure all this stuff out.
@All,
As a follow-up experiment, relating to this particular workflow, I tried to cache pre-signed URLs in Redis:
www.bennadel.com/blog/3685-performance-case-study-caching-cryptographically-signed-urls-in-redis-in-lucee-5-2-9-40.htm
It turns out (as I mention in this post) that generating Amazon S3 pre-signed URLS is surprisingly expensive. And, that the HTTP overhead of calling Redis is significantly less expensive. Which means that caching the URLs in Redis has a non-trivial affect on the overall latency of the request.
This morning, I tested something that I've been meaning to test forever: parallel iteration vs. chunked parallel iteration:
www.bennadel.com/blog/4661-parallel-iteration-vs-chunked-parallel-iteration-in-lucee-cfml.htm
Essentially, I wanted to compare vanilla parallel iteration, where a new, different thread is spawns for each element in the array vs. splitting a large array into a finite set of smaller arrays and then only spawning a thread per chunk (and then doing synchronous looping internally to the chunk).
Clearly, parallel iteration is not a one-size-fits all; but, there's a lot of wiggle room to improve performance over straight-up synchronous iteration.