Gathering CPU Load, Garbage Collection Time, Thread Dumps And Other JVM Metrics In ColdFusion
A few months ago, I looked at generating a Java thread dump programmatically using ColdFusion. I was doing that as part of an ongoing effort to find processing bottlenecks in the main ColdFusion application that we have at InVision. Along with those Thread Dumps, I've also been collecting a myriad of StatsD metrics relating to CPU load, garbage collection times, and thread state. Recently, however, we've begun migrating our StatsD metrics over to New Relic's agent-based instrumentation. Which means, all of my explicit JVM introspection is being deprecated. As such, I figured I'd share the code that I cobbled together in case it is helpful for others.
ASIDE: I just wanted to give a huge shout-out to Adnan Kobir, who's been our de facto internal Java expert and has worked tirelessly to help us tune the ColdFusion JVM. I understand about 20% of what he says about the JVM. And, even less of what he says about Kubernetes (K8).
All of the actual JVM metrics that I am reading come from the Java Management Beans. In reality, my code is just a thin layer over these beans that makes their consumption in a ColdFusion context a bit easier. This is especially true for the Garbage Collection metrics, which are reported as a running-total of wall-clock time since the JVM started.
Before we look at how these metrics are calculated, let's look at how they are consumed. At work, I read and record (StatsD) these metrics inside of the Kubernetes (K8) readiness check end-point. This is called about once every 10-seconds - per pod - which gives us a nice "pulse" of system activity. For the sake of this demo, however, I'll just read and output the JVM metrics in a simple CFML page.
The JVM metrics are being exposed by the JvmHelper.cfc ColdFusion component, which is cached in the Application scope:
<cfscript>

	// Create a short-hand reference for the demo.
	jvmHelper = application.jvmHelper;

	// Collect the JVM metrics, like a boss! Woot woot :D
	processors = jvmHelper.getProcessors();
	cpuLoad = jvmHelper.getCpuLoad();
	cpuLoadForSystem = jvmHelper.getCpuLoadForSystem();
	gcStats = jvmHelper.getGcStats();
	memoryUsageForHeap = jvmHelper.getMemoryUsageForHeap();
	threadStats = jvmHelper.getThreadStats();
	threadDump = jvmHelper.getThreadDump();

</cfscript>

<cfoutput>

	<h1>
		JVM Metrics For ColdFusion
	</h1>

	<h2>
		CPU Load (%0-100)
	</h2>

	<ul>
		<li>
			<strong>JVM:</strong> #encodeForHtml( cpuLoad )#
		</li>
		<li>
			<strong>System:</strong> #encodeForHtml( cpuLoadForSystem )#
		</li>
		<li>
			<strong>Processors:</strong> #encodeForHtml(  processors )# (count)
		</li>
	</ul>

	<h2>
		Garbage Collection Stats, CPU Time (%0-100)
	</h2>

	<ul>
		<cfloop item="algorithm" collection="#gcStats#">
			<li>
				<strong>#encodeForHtml( algorithm )#</strong>:
				#encodeForHtml( gcStats[ algorithm ] )#
			</li>
		</cfloop>
	</ul>

	<h2>
		Memory Usage Stats
	</h2>

	<ul>
		<li>
			<strong>Committed:</strong> #encodeForHtml( memoryUsageForHeap.committed )#
		</li>
		<li>
			<strong>Used:</strong> #encodeForHtml( memoryUsageForHeap.used )#
		</li>
		<li>
			<strong>Max:</strong> #encodeForHtml( memoryUsageForHeap.max )#
		</li>
	</ul>

	<h2>
		Thread Stats
	</h2>

	<ul>
		<cfloop item="type" collection="#threadStats#">
			<li>
				<strong>#encodeForHtml( type )#</strong>:
				#encodeForHtml( threadStats[ type ] )#
			</li>
		</cfloop>
	</ul>

	<h2>
		Thread Dump
	</h2>

	<pre>#encodeForHtml( threadDump )#</pre>

</cfoutput>
As you can see, some of the exposed values are simple numbers; and, some are collections of numbers.
I will mention that the metrics relating to Garbage Collection (GC) change depending on which GC algorithms you have configured in the JVM. For example, when I run this CFML page in CommandBox, the GC metrics come back as "PS MarkSweep" and "PS Scavenge"; however, when I run these metrics in production, they come back as "G1 Young Generation" and "G1 Old Generation".
That said, when we run this ColdFusion code, we get the following page output:
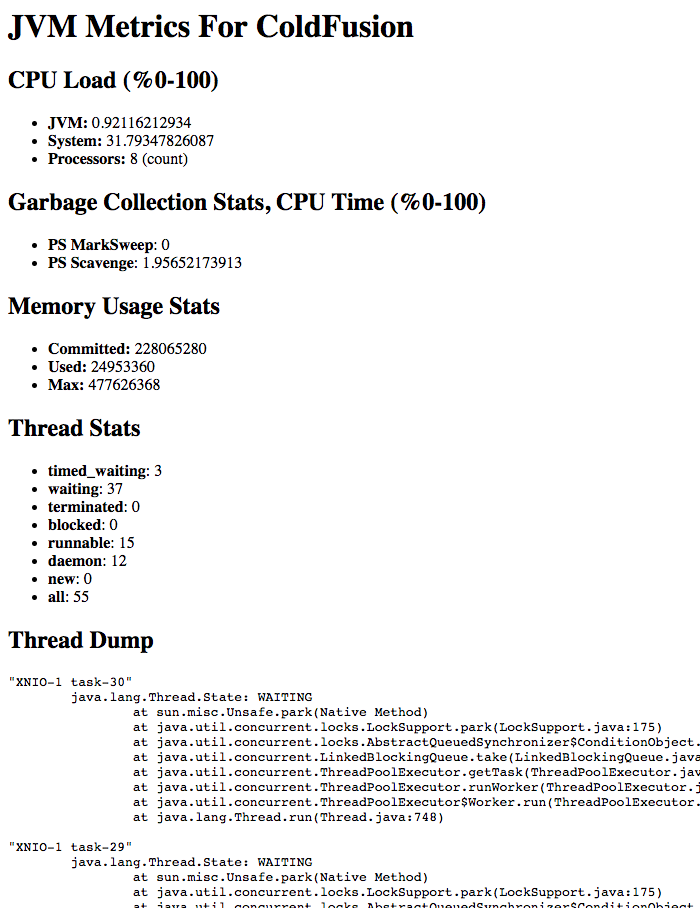
My ultimate hope was that I would one day be able to take these metrics and use them to influence the response of the Kubernetes (K8) readiness check. However, I never got to a point where I felt like I understood the values enough to know how - or if - I should use them to try and fail a pod out of rotation. That said, these metrics were still helpful in creating a pattern of usage that allowed me to - manually - see deviations and problematic behavior.
Here's the code for the JvmHelper.cfc, heavily commented in classic "Ben" style:
component
	output = false
	hint = "I help inspect the state of the JVM that is running ColdFusion, and the system on which is running."
	{

	/**
	* I initialize the JVM Helper. The JVM Helper is a thin proxy around the underlying
	* Java management objects that expose metrics pertaining to memory, CPU, threads,
	* garbage collection (and a host of other things).
	*
	* @output false
	*/
	public any function init() {

		// The ManagementFactory provides access to the underlying MXBeans, which expose
		// metrics around the low-level JVM instrumentation.
		// --
		// Read More: https://docs.oracle.com/javase/8/docs/api/java/lang/management/package-summary.html
		variables.javaManagementFactory = createObject( "java", "java.lang.management.ManagementFactory" );

		// The JVM will only have a single instance of the OperatingSystemMXBean, which
		// exposes the management interface for the operating system on which the Java
		// virtual machine is running.
		variables.operatingSystemMXBean = javaManagementFactory.getOperatingSystemMXBean();

		// The JVM may have several instances of the GabageCollectionMXBean, depending on
		// which Garbage Collection (GC) algorithm is currently in place. If the GC
		// algorithm is changed, the NAME of these beans will also change. These beans
		// expose information about the amount of CPU time that is being used to find and
		// reclaim unused memory space.
		variables.garbageCollectorMXBeans = javaManagementFactory.getGarbageCollectorMXBeans();

		// The JVM will only have a single instance of the ThreadMXBean, which exposes
		// the management interface for the threads running on the JVM.
		variables.threadMXBean = javaManagementFactory.getThreadMXBean();

		// The JVM will only have a single instance of the MemoryMXBean, which exposes
		// the management interface for the memory system of the JVM.
		variables.memoryMxBean = javaManagementFactory.getMemoryMXBean();

		// The garbage collection information reported by the MXBeans consists of running
		// totals (around Time and Counts) since the JVM was started. As such, we have to
		// keep track of when the GC information was last checked such that we can
		// determine the delta-time and then calculate what percentage of that time was
		// taken by GC processing load. Each cache item will contain "timeChecked" and
		// "timeSpent". But, we won't know the cache items ahead of time as the GC
		// algorithm is different in each JVM environment (depending on which algorithm
		// is current in place).
		variables.gcCache = {};

	}

	// ---
	// PUBLIC METHODS.
	// ---

	/**
	* I return the number of processors available to the JVM.
	*
	* @output false
	*/
	public numeric function getProcessors() {

		return( operatingSystemMXBean.getAvailableProcessors() );

	}

	/**
	* I return the percentage of CPU time (0..100, inclusive) that was recently consumed
	* by the JVM process.
	*
	* @output false
	*/
	public numeric function getCpuLoad() {

		// CAUTION: The ".getProcessCpuLoad()" method is documented in Java 7 but no
		// longer appears in the Java 8+ documentation. However, this method continues to
		// work on some JVMs as a hidden set of features. The implementation details here
		// may need to change depending on which JVM you are using.
		var cpuLoad = ( operatingSystemMXBean.getProcessCpuLoad() * 100 );

		// If the CPU values cannot be measured in this JVM, the above method will
		// return a negative value. In such cases, we'll create a local minimum of zero.
		return( minOfZero( cpuLoad ) );

	}


	/**
	* I return the percentage of CPU time (0..100, inclusive) that was recently consumed
	* by the System process (ie, the whole system).
	*
	* @output false
	*/
	public numeric function getCpuLoadForSystem() {

		// CAUTION: The ".getSystemCpuLoad()" method is documented in Java 7 but no
		// longer appears in the Java 8+ documentation. However, this method continues to
		// work on some JVMs as a hidden set of features. The implementation details here
		// may need to change depending on which JVM you are using.
		var cpuLoad = ( operatingSystemMXBean.getSystemCpuLoad() * 100 );

		// If the CPU values cannot be measured in this system, the above method will
		// return a negative value. In such cases, we'll create a local minimum of zero.
		return( minOfZero( cpuLoad ) );

	}


	/**
	* I return the garbage collection statistics for the JVM. These stats are relative to
	* when this method WAS LAST CALLED. As such, it makes sense to call this method on an
	* ongoing interval in order to observe the "pulse" of the memory management. The keys
	* returned in the resultant object will change depending on which GC algorithms are
	* in place. For example, the results might contain the following keys on one system:
	*
	* - "PS MarkSweep"
	* - "PS Scavenge"
	*
	* ... and then the following keys on another system:
	*
	* - "G1 Young Generation"
	* - "G1 Old Generation"
	*
	* CAUTION: This method uses an internal lock; and, will throw an error if the lock
	* cannot be obtained.
	*
	* @output false
	*/
	public struct function getGcStats() {

		// Since the garbage collection stats are based on running totals, we need to
		// synchronize access to our metric cache so that potentially-overlapping calls
		// to this method don't corrupt the cache.
		lock
			name = getGcStatsLockName()
			type = "exclusive"
			timeout = 1
			throwOnTimeout = true
			{

			var results = {};

			for ( var bean in garbageCollectorMXBeans ) {

				var beanName = bean.getObjectName().getKeyProperty( javaCast( "string", "name" ) );

				// Since we don't know which GabageCollectionMXBean instances will be
				// available ahead of time, our cache will be empty the first time this
				// method is invoked.
				if ( ! structKeyExists( gcCache, beanName ) ) {

					gcCache[ beanName ] = {
						timeChecked: 0,
						timeSpent: 0
					};

				}

				// Because we defaulted our cache to use "0", we'll know that this is the
				// first check based on the cached value.
				var previousCheck = gcCache[ beanName ];
				var isFirstCheck = ( previousCheck.timeChecked == 0 );

				// Get the current, running totals for the current GC Bean (ie, the
				// amount of time that was spent performing garbage collection). If the
				// total is unavailable for this system, a -1 will be returned. In such
				// cases, we'll create a local minimum of 0.
				var timeChecked = getTickCount();
				var timeSpent = minOfZero( bean.getCollectionTime() );

				// Compare the current totals to the cached totals.
				var timeCheckedDelta = ( timeChecked - previousCheck.timeChecked );
				var timeSpentDelta = ( timeSpent - previousCheck.timeSpent );

				// Cache the current totals for the next check.
				previousCheck.timeChecked = timeChecked;
				previousCheck.timeSpent = timeSpent;

				// Because the CPU load calculation is based on cached values in the
				// ColdFusion memory space, a refresh of the application without a
				// restart of the JVM will lead to inaccurate numbers. As such, if this
				// is the first check (as far as ColdFusion is concerned), then we have
				// to return zero, deferring to future checks for better accuracy.
				// --
				// NOTE: We're also protecting against a divide-by-zero error if the
				// gc-load is called multiple times within the same millisecond (which
				// appears to be possible based on observed error logs).
				if ( isFirstCheck || ! timeCheckedDelta ) {

					results[ beanName ] = 0;

				// If this is NOT THE FIRST CHECK, the we can calculate how much of the
				// CPU time was consumed by garbage collection (since the last check) by
				// comparing the GC time to the wall-clock time.
				} else {

					results[ beanName ] = ( timeSpentDelta / timeCheckedDelta * 100 );

				}

			} // END: For-loop.

			return( results );

		} // END: Lock.

	}


	/**
	* I return the synchronization lock name for the GC stats access.
	*
	* @output false
	*/
	public string function getGcStatsLockName() {

		return( "jvmHelper.getGcStats" );

	}


	/**
	* I return the amount of memory allocated for the heap portion of the JVM.
	*
	* @output false
	*/
	public struct function getMemoryUsageForHeap() {

		var jvmMemoryUsage = memoryMxBean.getHeapMemoryUsage();

		// NOTE: Since the max does not need to be set, it will return -1 if undefined.
		// In such cases, we'll create a local minimum of zero.
		var results = {
			max: minOfZero( jvmMemoryUsage.getMax() ),
			committed: jvmMemoryUsage.getCommitted(),
			used: jvmMemoryUsage.getUsed()
		};

		return( results );

	}


	/**
	* I return the amount of memory allocated for the non-heap portion of the JVM.
	*
	* @output false
	*/
	public struct function getMemoryUsageForNonHeap() {

		var jvmMemoryUsage = memoryMxBean.getNonHeapMemoryUsage();

		// NOTE: Since the max does not need to be set, it will return -1 if undefined.
		// In such cases, we'll create a local minimum of zero.
		var results = {
			max: minOfZero( jvmMemoryUsage.getMax() ),
			committed: jvmMemoryUsage.getCommitted(),
			used: jvmMemoryUsage.getUsed()
		};

		return( results );

	}


	/**
	* I return a full thread-dump of the current JVM state. This will show what each
	* thread is doing at [roughly] this moment.
	*
	* @maxStackDepth I determine the maximum number of StackTraceElement items to be retrieved from the stack trace.
	* @output false
	*/
	public string function getThreadDump( numeric maxStackDepth = 30 ) {

		// Each line of the thread dump is going to be appended to this buffer. Then
		// this buffer will be collapsed down into a single string.
		var buffer = [];
		var newline = chr( 10 );
		var tab = chr( 9 );

		// Get the thread meta-data for all current threads.
		// --
		// CAUTION: Since gathering the IDs and gathering the meta-data are two separate
		// actions, there is a chance that some of the threads (corresponding to gathered
		// IDs) will no longer exist by the time the meta-data is gathered. In such
		// cases, the thread meta-data will be undefined in the resulting array.
		var allThreadIDs = threadMXBean.getAllThreadIds();
		var allThreads = threadMXBean.getThreadInfo( allThreadIDs, javaCast( "int", maxStackDepth ) );
		var allThreadsCount = arrayLen( allThreads );

		for ( var i = 1 ; i <= allThreadsCount ; i++ ) {

			// If the thread no longer existed by the time the meta-data was gathered,
			// skip over it.
			if ( ! arrayIsDefined( allThreads, i ) ) {

				continue;

			}

			var threadInfo = allThreads[ i ];

			arrayAppend( buffer, """#threadInfo.getThreadName()#""" );
			arrayAppend( buffer, "#tab#java.lang.Thread.State: #threadInfo.getThreadState().toString()#" );

			for ( var stackTraceElement in threadInfo.getStackTrace() ) {

				arrayAppend( buffer, "#tab##tab#at #stackTraceElement.toString()#" );

			}

			arrayAppend( buffer, "" );

		}

		return( arrayToList( buffer, newline ) );

	}


	/**
	* I return the thread statistics for the JVM.
	*
	* @output false
	*/
	public struct function getThreadStats() {

		var results = {
			"all": threadMXBean.getThreadCount(),
			"daemon": threadMXBean.getDaemonThreadCount(),
			"blocked": 0,
			"new": 0,
			"runnable": 0,
			"terminated": 0,
			"timed_waiting": 0,
			"waiting": 0
		};

		var allThreads = threadMXBean.getThreadInfo( threadMXBean.getAllThreadIds() );
		var allThreadsCount = arrayLen( allThreads );

		for ( var i = 1 ; i <= allThreadsCount ; i++ ) {

			// If one of the threads dies in between getting the IDs and getting the
			// state, it will come back as NULL. As such, we have to make sure the array
			// is defined at the given offset.
			if ( arrayIsDefined( allThreads, i ) ) {

				switch ( allThreads[ i ].getThreadState().toString() ) {
					case "BLOCKED":
						results.blocked++;
					break;
					case "NEW":
						results.new++;
					break;
					case "RUNNABLE":
						results.runnable++;
					break;
					case "TERMINATED":
						results.terminated++;
					break;
					case "TIMED_WAITING":
						results.timed_waiting++;
					break;
					case "WAITING":
						results.waiting++;
					break;
				}

			}

		}

		return( results );

	}

	// ---
	// PRIVATE METHODS.
	// ---

	/**
	* I return zero if the given value is negative.
	*
	* @value I am the value being inspected.
	* @output false
	*/
	private numeric function minOfZero( required numeric value ) {

		return( max( value, 0 ) );

	}

}
Anyway, I hope this is helpful for someone else. I know that a lot of the logic in this ColdFusion component is based on various Java articles and StackOverflow answers that were written by others; so, this is my attempt to pay all of that kindness forward.
Want to use code from this post? Check out the license.

Reader Comments
Thanks for sharing this and "paying it forward". Looking forward to trying it out. I'm becoming more and more aware of the need to understand the JVM and Java layer more clearly when working with ColdFusion. Always, always appreciate your insights and explanations!
@Matthew,
Glad you found this interesting. I'm working on a follow-up post to demonstrate how take the
JvmHelper.cfcand integrate it with my Kubernetes readiness check. Though, to be completely honest, I was never able to get confident in actually failing a machine out of rotation. That said, I am graphing all of these metrics in StatsD, which - at the very least - gives me a sense of how the machines are doing.I'll link to the post when I have finished it (likely tomorrow morning).
Thanks you for everything, Ben!
A curiosity, why didn't you use FusionReactor to do this?
@Paolo,
We didn't have FusionReactor available :( I love FusionReactor. But, our platform people could never quite figure out how to handle the registration on dynamically created machines. I think, today, FusionReactor is more "cloud friendly"; but, back when we were using it, you had to register and then unregister license numbers as you brought machines online and then, later, killed them. This lead to constant problems on our end. So, the platform team decided to abandon the product.
But, for my money, there's no product that works as well for ColdFusion than FusionReactor. I miss it every day, to be totally honest.
Also, I was trying to build logic that I could integrate with the application that would power the Kubernetes (K8) readiness check. I never quite got it working. But, I'm going to share my logic in the next blog post.
@All,
I wanted to follow-up this post with another post on how I had hoped to consume these JVM metrics in a Kubernetes readiness check:
www.bennadel.com/blog/3639-the-hope-of-using-jvm-metrics-to-drive-the-readiness-check-in-kubernetes-k8-and-coldfusion.htm
I never quite got there - not to the point where I could pull pods out of rotation automatically. But, I think there's some interesting patterns in this code with regard to atomic data types and managing asynchronous code.
Does it Support Lucee, I think NO
@Gurpreet,
Yes, it supports both Lucee and Adobe ColdFusion. In fact, we are running Lucee at work with this code (or similar code). Ultimately, it's just reaching under the hood to the Java code.
That said, some of the things may be slightly different depending on which version / platform of Java you have.
Hi ben, It seems that the JVM CFC does not work with ucee anymore, it just throws errors on all the methods
@IsSet,
Hmm, that's strange. I'm still using this (a modified version of this); but, I'm on a slightly earlier version of Lucee 5.2.x. Can you give me an example of what kind of error is being thrown?
I get this Error
Unable to make public double com.sun.management.internal.OperatingSystemImpl.getProcessCpuLoad() accessible: module jdk.management does not "opens com.sun.management.internal" to unnamed module @b95e1af
And Lucee version is:
Lucee 5.3.4.80
@IsSet,
Wow, I have no idea. I wonder if it has to do with your version of Java? I'm still running all my stuff on Java 8 (1.8) I think. It sounds like you may be running on a newer version of Java that has some breaking changes. Here's what I get when I check my version of Java:
I'm also running the Open JDK version - maybe you are running the Sun version. I'm not really a "Java person", so I don't really know how this stuff influences the functionality.
Here is my Java version @ben
It has something weird going on
http://prntscr.com/rn60dj
mine is not openJDK, because i have other coldfusion versions installed on the system too
@IsSet,
Unfortunately, I'm not really a "java" guy 😞 As such, I don't really have an instinct for what is going wrong. My guess would be that your version of Java doesn't expose the same MX Beans? But that's really just a question. I am sorry that I cannot be more help.
Hi all,
I came across this thread and thought I'd share my situation and solution.
Running on ACF2021 under CommandBox I was getting the
module jdk.management does not "opens com.sun.management.internalexception. This is do to the fact that CommandBox had recently moved from Java8 to Java11. One issue that can surface during migration from 8 to 11 results from increased enforcement of security rules when accessing Java internal classes.That
WARNING: All illegal access operations will be denied in a future releasemessage, which I quit paying attention to, finally landed. ;)After I had solved it, the error message was actually quite helpful. Just needed to this to my JVM arguments:
'--add-opens 'jdk.management/com.sun.management.internal=ALL-UNNAMED`
Be aware you could be opens'ing doors that are meant to be closed, though the syntax allows you to be more specific about which modules are granted access. Also not really a Java guy, so I don't know the simplest, secure way to make that happen under Coldfusion. I'd wager security-types would not allow it, at all, and shame on you for asking.
Here's the relevant Oracle JDK Migration Guide section
Cheers!
That link does not go to right bookmark, see the Oracle JDK Migration Guide - Understanding Runtime Access Warnings section.
Michael
@Michael,
Ah, very good to know. We need to start thinking about upgrading our Java version. We've been holding off on it since I think it would require us to upgrade our AWS SDK, which - at first blush - looks like it will actually require a good deal of code-changes... and, you know, only so many hours in the day.
One thing that I recently experienced with the JVM metrics is that after we upgraded our version of Lucee CFML recently, the "System CPU" values are super high. But, only in the graphs - when I look at a given container and look at the System CPU, it shows normal - but according to the MXBean values, the System CPU is like 100% or higher. No idea how the Lucee upgrade messed that up at all. But, at least the "JVM CPU" metrics seems to still be accurate.