Experimenting With Tagged Proxy Database Metrics Using DogStatsD In ColdFusion
Last week, I added DataDog's DogStatsD functionality to StatsDGateway - my StatsD library for ColdFusion. For me, the most exciting feature-add in DogStatsD is the ability to tag metrics. Tagging allows each metric to be associated with any number of key-value tags (soft limit) that can then be used to breakdown metrics in DataDogHQ's visualizations, monitors, and alerts. To explore the power of tagging in DogStatsD, I wanted to experiment with creating instrumented proxies for my database gateway components that would time and tag all database access.
My typical database access pattern separates business logic from data access. So, generally speaking, I'll have some sort of Service component that accepts one or more Database Gateway components in order to fulfill its requirements:
var myService = new MyService( new MyServiceGateway( dsn ) )
The beauty of this pattern is that I can easily swap out Gateway implementations. Or, in this case, easily wrap and proxy existing Gateway implementations. So, for this exploration, I want to take all of my MySQL Database Gateway components and proxy them such that each method call - which represents data access - can be timed (in millisecond duration) and tagged. The tag will consist of the gateway name and the method name:
.timing( "db-gateway", msDuration, [ "method:#targetName#.#methodName#" ] )
Notice that each database access method is getting recorded under the same StatsD metric: "db-gateway". While this metric could theoretically give us a general overview of all database access, it's the tagging that will give us the real power and insight.
To explore DataDogHQ, I'm using my blog, which exposes a fairly small landscape of functionality. I bring this up because I know that the number of data access methods in my blog is limited in scope. Which means that I have a very finite number of tags that may get created. This is important to keep in the back of your mind because DataDog recommends that no metric should be associated with more than 1,000 tags:
FROM THE DATADOG DOCUMENTATION: We store one time series per host + metric + tag combination on our backend, thus we cannot support infinitely bounded tags. Please don't include endlessly growing tags in your metrics, like timestamps or user ids. Please limit each metric to 1000 tags.
I'm told by my teammates that this is a soft limit and has more to do with the rendering performance in DataDog's dashboards once you reach a larger number of tags. But, if you have a large number of data access methods, you might need to segment them into different metric names.
That said, creating a proxy component in ColdFusion is fairly easy thanks to the dynamic power of the getFunctionCalledName() function. This function allows us to get the name of the contextual method at invocation time. In the past, I've used this function to create Retry Proxies for MySQL's innodb_lock_wait_timeout errors. Today, I'm just using it to wrap a timer around target method invocation:
component
	output = false
	hint = "I instrument the given component with tagged timers."
	{

	/**
	* I initialize the instrumented proxy for the given target. The resultant component
	* will have the same methods and public properties that the target has.
	*
	* CAUTION: All public properties are copied into the proxy at initialization time. As
	* such, this approach cannot be used with components whose public properties change
	* over time. Properties and methods have to be static once the underlying component
	* has been created and proxied.
	*
	* @dogstatsD I am the DogStatsD implementation for metrics.
	* @metricName I am the name of the metric being recorded.
	* @targetName I am the name of the target (ie, the runtime instance name) being instrumented.
	* @target I am the target instance being instrumented.
	* @output false
	*/
	public any function init(
		required any dogstatsD,
		required string metricName,
		required string targetName,
		required any target
		) {

		// Store the private properties.
		variables.dogstatsD = arguments.dogstatsD;
		variables.metricName = arguments.metricName;
		variables.targetName = arguments.targetName;
		variables.target = arguments.target;

		generateProxyProperties();

		return( this );

	}

	// ---
	// PUBLIC METHODS.
	// ---

	// ... methods will be generated from the __proxy_method__ function.

	// ---
	// PRIVATE METHODS.
	// ---

	/**
	* I implement the instrumented wrapper around the underlying method. The underlying
	* method is determined by the runtime function name.
	*
	* CAUTION: We are omitting any output settings because the proxied method may
	* generate output that we don't want to suppress.
	*/
	private any function __proxy_method__() {

		// All instrumented methods will record the same metric. However, each call will
		// be tagged with the target name and method name (ex, "wigetGateway.getWidgets")
		// so that the metric can be broken down by gateway method.
		var methodName = getFunctionCalledName();
		var tags = [ "method:#targetName#.#methodName#" ];
		var startedAt = getTickCount();

		try {

			return( invoke( target, methodName, arguments ) );

		} finally {

			dogstatsD.timing( metricName, ( getTickCount() - startedAt ), tags );

		}

	}


	/**
	* I generate the proxy methods and properties based on the current structure of the
	* target component. Methods are given a proxy invocation. Non-method properties are
	* copied into the proxy. As such, changes to the API of the target component will not
	* be propagated once the proxy has been created.
	*
	* @output false
	*/
	private void function generateProxyProperties() {

		for ( var property in target ) {

			if ( ! structKeyExists( target, property ) ) {

				continue;

			}

			var value = target[ property ];

			// Create a proxy method reference for each target method.
			if ( isCustomFunction( value ) || isClosure( value ) ) {

				this[ property ] = __proxy_method__;

			// Copy non-method target properties into the proxy.
			} else {

				this[ property ] = value;

			}

		}

	}

}
As you can see, each method in the target component gets is own reference to the shared __proxy_method__ method. At runtime, this proxy method will get the name of the function being invoked; and, in turn, invoke the same method on the target component, recording the duration of execution and tagging the metric with the target method name before returning the underlying result.
Once all of the database access components have been wrapped in this DogStatsD instrumented proxy, I can then create DataDogHQ dashboards that visualize the database access by tag:
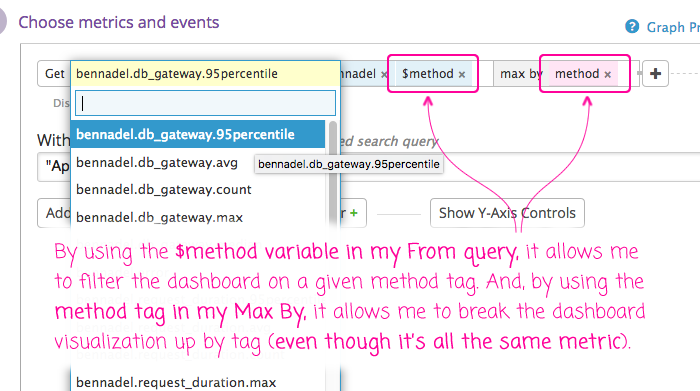
In this case, I'm using the "method" tag in two places: the From field, which allows me to filter the dashboards based on a variable value; and, the Max By field, which will break the visualization down by tag value. This results in these funky fantastic graphs:
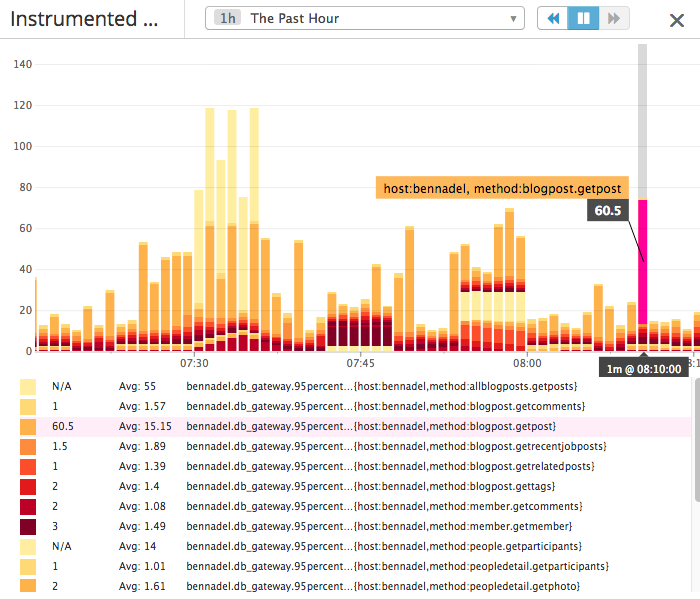
As you can see, this single "db-gateway" method is being broken down by the value of the "method" tag. With the help of DogStatsD tagging, I can now see the frequency with which database methods are called; and, the time that they take to execute. How freaking cool is that?!
And, this same breakdown can be used in DataDogHQ's monitoring. For example, I could set up a monitor and alert to see if any of the database access methods take too long to execute:
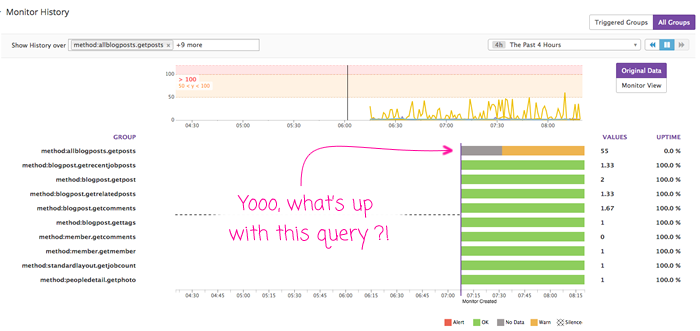
Immediately, I can see from this kind of breakdown that one of the database access methods is performing worse than most of the others. Now, I can go in and see what kind of performance optimizations and caching strategies I might be able to apply.
I'm still fairly new to DataDogHQ; and, I'm extremely new to the concept of tagging metrics. But, I'm beginning to see that tagging offers a tremendous amount of value to application performance monitoring. And, thankfully ColdFusion makes it really easy to take existing database access components and instrument them with DogStatsD timers (which are really just "histograms" under the hood).
Want to use code from this post? Check out the license.

Reader Comments