Dynamically Instrumenting ColdFusion Component Methods With GetTickCount() To Locate Performance Bottlenecks
ColdFusion is a highly dynamic language. Which means, we can perform all manner of runtime mutations and reflections on our data structures and components. In fact, I've talked about this concept many times before, from applying StatsD metrics to creating tracked transactions in FusionReactor to adding retry logic around database access calls. All of these approaches use a variation on the same theme: generating proxy methods that add logic around lower-level component method execution. And today, in an effort to identify the performance bottlenecks in my CUID2 for ColdFusion implementation, I'm doing it again!
ASIDE: Ideally, I would just use FusionReactor to inspect the execution alongside whatever memory and CPU pressures might exist. But, I don't have a containerized version of my code where I have FusionReactor running.
Yesterday, James Moberg pointed out that the Java implementation of CUID2 is significantly faster than my ColdFusion implementation. I assumed that the performance bottleneck was my use of the ColdFusion-native hash() function, since it has to do some unfortunate type-casting. However, when I swapped hash() with Java's MessageDigest class, the performance was roughly the same.
In order to get a sense of where the performance bottleneck(s) might exist, I wanted to wrap each method in a time measurement using getTickCount(). But, adding this manually to each method would be tedious (and not every exciting). Instead, I decided to use some meta-programming.
My approach works by moving every method in a given Cuid2.cfc instance into a privately-scoped alias. Then, I replace all of the original method references with a proxy method that propagates the execution to the original, privately-scoped alias and records the execution time.
All of this logic is encapsulated inside an Instrumenter.cfc ColdFusion component. This component has a single public method, instrument(), which takes the target component instance and returns a Struct. The returned Struct acts as an aggregate of all the timing data across all of the method invocations. This way, I can generate a lot of tokens and then simply CFDump-out the timings struct to see how the various methods are performing.
component
	output = false
	hint = "I instrument a given ColdFusion component."
	{

	/**
	* I instrument each method within the given target ColdFusion component and return a
	* struct that will contain the aggregate execution times for each method, by name. By
	* default, the timings will be recorded in Milliseconds; but, you can pass-in "nano"
	* for high-precision readings.
	*/
	public struct function instrument(
		required any target,
		string units = "milli"
		) {

		var timings = {};

		// Slide the injector method right into the public scope and invoke it.
		target.__inspector__ = variables.inspector;
		target.__inspector__( timings, units );

		return( timings );

	}

	// ---
	// PRIVATE METHODS.
	// ---

	/**
	* I inspect the CURRENT CONTEXT, replacing each method with one that proxies the
	* original methods and records the execution times.
	*/
	private void function inspector(
		required struct targetMethodTimings,
		required string targetMethodUnits
		) {

		// CAUTION: This method is being invoked IN THE CONTEXT OF THE TARGET COMPONENT.
		// As such, both the THIS and VARIABLES references here are scoped to the target
		// component, not to the Instrumenter component!
		getMetadata( this ).functions.each(
			( method ) => {

				var scope = ( method.access == "public" )
					? this
					: variables
				;

				var originalName = method.name;
				var proxyName = ( "__" & method.name & "__" );

				// Setup the default timings entry for this method.
				targetMethodTimings[ originalName ] = 0;

				// COPY the original function reference into the private scope where it
				// can be invoked from our proxy function without muddying-up the public
				// API of the original component.
				variables[ proxyName ] = scope[ originalName ];
				// OVERRIDE the original function with our properly-scoped proxy.
				scope[ originalName ] = () => {

					var startedAt = getTickCount( targetMethodUnits );

					try {

						return( invoke( variables, proxyName, arguments ) );

					} finally {

						targetMethodTimings[ originalName ] += ( getTickCount( targetMethodUnits ) - startedAt );

					}

				};

			}
		);

	}

}
In this Instrumenter.cfc component, the inspector() method acts as the tunnel into the target component. Since this method is not a closure, when injected into and invoked on the target component, it will execute in the context of the target component, granting access to both the variables scope and the this scope of the target component.
But, while the inspector() method is not a closure, the generated proxy methods are closures. This gives them access to internal scopes as well as to the arguments that were passed into the inspector() method. This is how the proxy methods can write to the timings struct defined in the Instrumenter.cfc.
Closures are the bomb-diggity.
With all that said, we can now instrument our Cuid2.cfc instance and see where the execution times are being squeezed:
<cfscript>

	cfsetting( requestTimeout = 300 );

	length = 24;
	cuid = new lib.Cuid2( length );
	count = 1000000;

	// Inject all the proxy timing methods into the CUID instance.
	timings = new Instrumenter().instrument( cuid );

	for ( i = 1 ; i <= count ; i++ ) {

		token = cuid.createCuid()

	}

	writeDump(
		label = "CUID Execution Times (#numberFormat( count )# Tokens)",
		var = timings
	);

	writeDump({
		"last-token": token
	})

</cfscript>
As you can see, we're instrumenting the Cuid2.cfc ColdFusion component, generating 1-million tokens, and then outputting the timing aggregate. And, when we run this ColdFusion code, we get the following output:
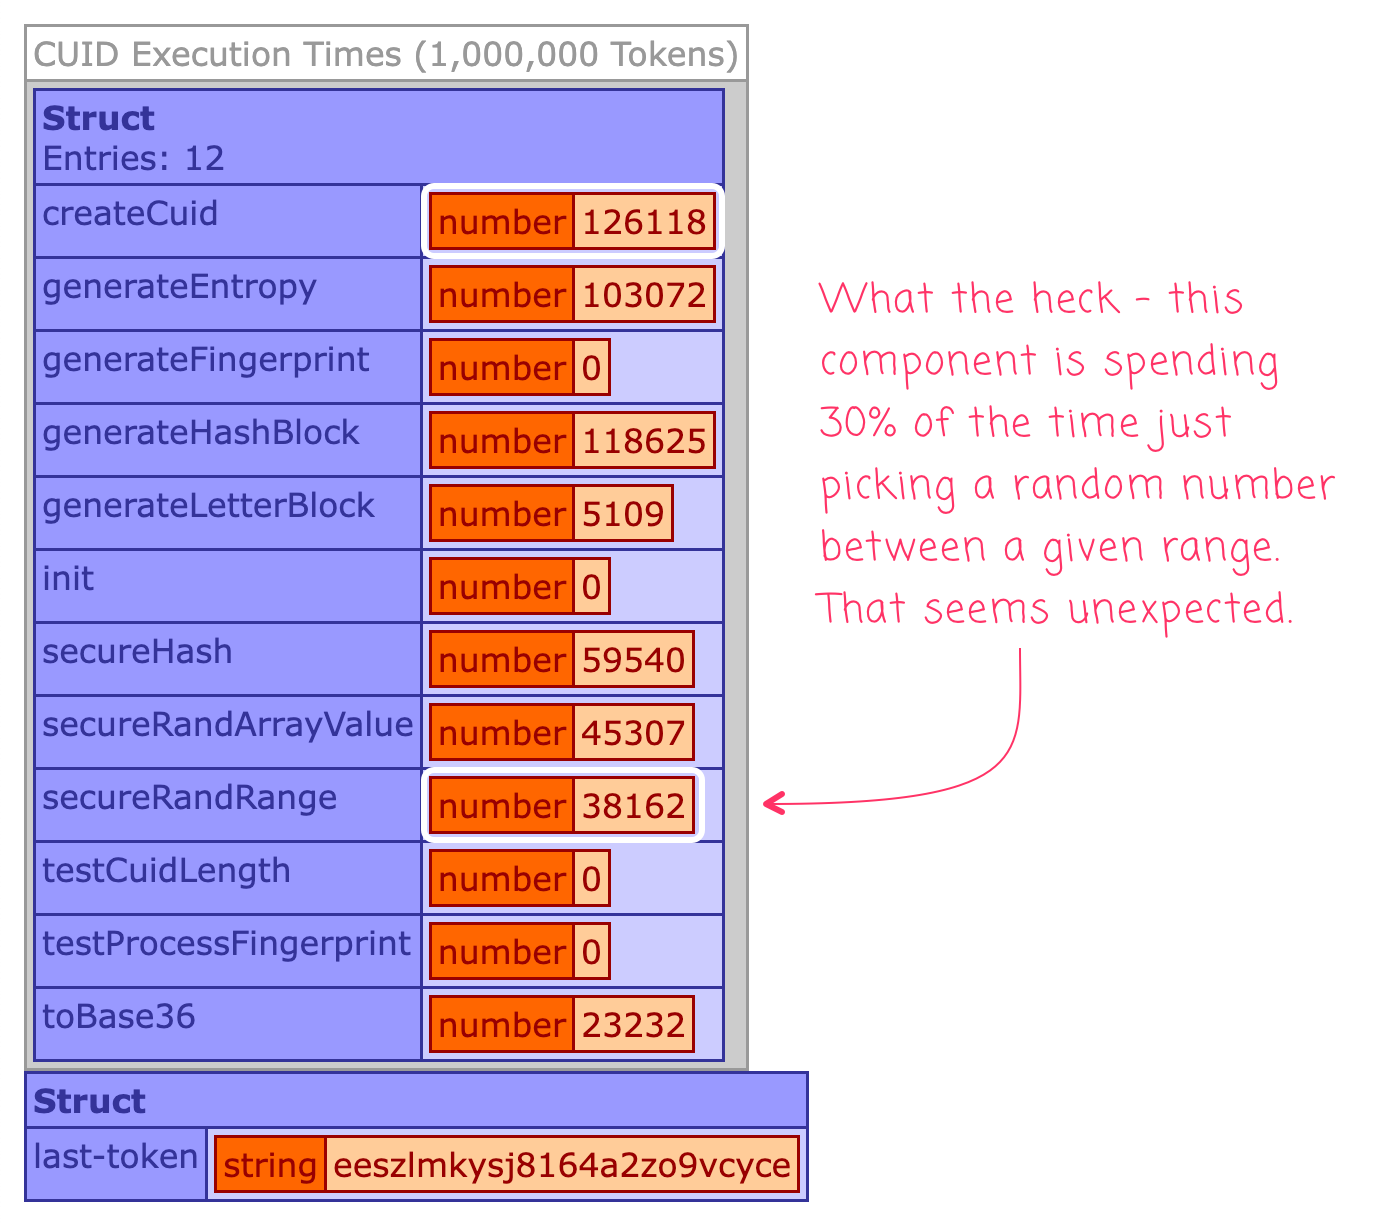
Very interesting and surprising results! This CUID2 component spends 30% of its overall execution time just pricking random numbers. Unlike FusionReactor - which shows how method invocations are nested - we only get the list of method names, which lacks any indication of relationship. However, if we look at the ColdFusion component source for Cuid2.cfc, the secureRandRange() method doesn't call any other methods - it's a "leaf node", so to speak, in the control flow. I'm not sure how much that can even be optimized.
But, this isn't a post on how to fix my CUID2 implementation, this is just a post on dynamically instrumenting ColdFusion component methods to get timing data. And, hopefully there's been something here that you found interesting.
Want to use code from this post? Check out the license.

Reader Comments
Hi Ben, thank you for your nice work!
Sorry, but why not use the native ColdFusion debug inspector activated via "Report Execution Times" ?
@Paolo,
Because I literally 100% forgot that ColdFusion had any debugging capabilities 🤣 🤣 🤣 Let me see if I can get that turned on.
@Paolo,
It looks like Lucee CFML gives the template times and the variable access counts, but not the execution times. I'll see if I can get Adobe ColdFusion's debugging enabled.