Including Tracing Headers In Nginx 1.18.0 Access Logs Using Custom Formatting
As I mentioned yesterday, we're trying to track down a mysterious logout issue at InVision. Part of this investigation involves trying to understand where an even more mysterious 502 Bad Gateway error is coming from. Due to the many layers of our network, it's proving difficult to figure out which "network hop" is failing. Yesterday, I looked at adding tracing headers to Amazon's ALB using X-Amzn-Trace-Id. Today, I want to look at adding tracing headers to the access logs in Nginx 1.18.0 using a custom log format.
CAUTION: I don't know very much about how nginx works. Nor do I know very much about configuring nginx. What I talk about in this post is just enough to get the tracing working. Please take this all with a grain of salt.
At the end of the day, what I want to see is a series of log entries that all have the same RequestID. Then, be able to take that evidence to our SREs (Site Reliability Engineers) to help understand why the request is failing at a particular layer.
I've already added the tracing headers to our ALB (Application Load Balancer); and, I've already added some access tracing logic in our ColdFusion applications; but, between the ALB and ColdFusion is:
- Kubernetes (K8) Ingress Controller.
- Nginx reverse proxy.
The Nginx reverse proxy sits inside the same container as our ColdFusion code. It manages the public port and serves-up static assets. And, forwards every other type of request to the ColdFusion server. The goal of adding tracing headers to the Nginx access logs is to see if the requests are making it to the containers but are not able to talk to ColdFusion. In other words, we're trying to rule out whether or not the 502 Bad Gateway is coming from the nginx → ColdFusion network hop.
Normally, we don't enable access logging in the nginx service in our ColdFucion containers since they are just a simple proxy pass-through and create hella noise in our log aggregation:
access_log /dev/null ;
Here, all the access logs are getting piped to /dev/null, which is the technical equivalent of screaming into Space. To help track down the 502 Bad Gateway, however, I've started piping the access logs to the Standard Out, which is then subsequently pipped into Loggly by our platform infrastructure:
access_log /dev/stdout ;
According to the nginx log-module documentation, the nginx access logs use a default formatter called "combined", which uses this configuration:
log_format combined '$remote_addr - $remote_user [$time_local] '
                    '"$request" $status $body_bytes_sent '
                    '"$http_referer" "$http_user_agent"';
In this case, the "combined" token is the name of the formatter; and then everything after it is the template for the log entry. All of the $ values are interpolated into the log entry at runtime.
Within the nginx request, I can access any HTTP header using the format:
$http_{ header }
As I mentioned in yesterday's post on the Amazon ALB, our application includes three tracing HTTP headers:
Request-ID- a unique ID for every request.Request-Source- the originator of the request.Calling-Source- the previous hop in the request's network chain.
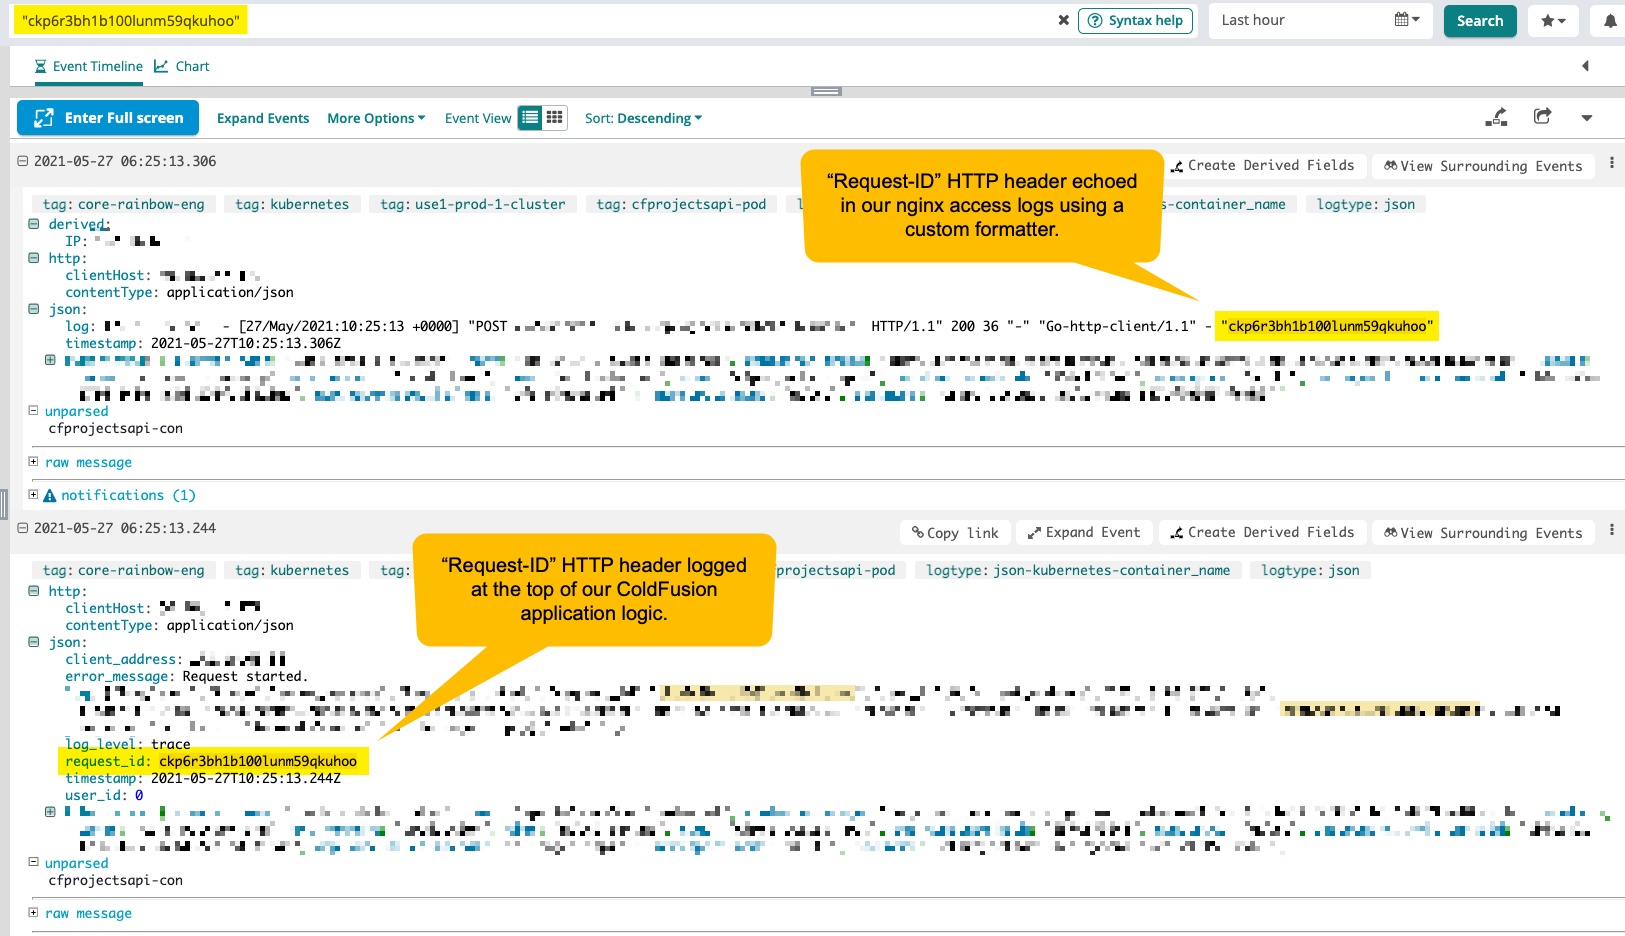
For this portion of the experiment, I really only care about the Request-ID HTTP header since I want to see where this value stops showing up in the network stack. To include this HTTP header value in the nginx access logs, I took the default combined format and created a custom one that also includes:
$http_request_id
I'm calling this formatter with_request_tracing:
log_format with_request_tracing '$remote_addr - $remote_user [$time_local] '
                                '"$request" $status $body_bytes_sent '
                                '"$http_referer" "$http_user_agent"'
                                ' - "$http_request_id"';
As you can see, this formatter uses all the same values as the default "combined" formatting, but appends $http_request_id in order to pluck the Request-ID HTTP header our of the request. And, once I had this formatter defined, I then had to tell nginx to use it for the access logs:
access_log /dev/stdout with_request_tracing ;
Now, with this in place, if I search in Loggly for a specific Request-ID HTTP header value, I can see it passing through both the nginx reverse proxy and our Lucee CFML application server (click for a larger version):
With this tracing in place, we can start to rule out if the 502 Bad Gateway error is happening at the nginx → ColdFusion network hop? Or, is it happening somewhere before nginx altogether. Isn't having a distributed system fun?!
Want to use code from this post? Check out the license.


Reader Comments