
Having Fun With The Horizontal Usage Of Position: Sticky In Angular 11.0.5
The CSS property of position: sticky is one of those new(ish) CSS features that can dramatically reduce the amount of JavaScript that you have to include in your application. position: sticky takes an element and "glues it" to the edge of the viewport as the user scrolls-across said element's container. The position: sticky feature works in both the vertical and the horizontal axes. However, I've only ever used it the vertical direction in order to create things like "sticky headers". As such, I thought it would be fun to sit down and try to apply position: sticky on the horizontal axis in Angular 11.0.5.
Run this demo in my JavaScript Demos project on GitHub.
View this code in my JavaScript Demos project on GitHub.
Part of the reason I've never used position: sticky on the horizontal axis is that I don't have a lot of content in my Angular applications that scroll horizontally. In general, a horizontal scroll is a poor user experience (UX). Many basic computer mouses don't have a horizontal scroll-wheel; and, believe it or not, not every user has a magic track pad! That said, sometimes, a horizontal scroll is the only way to arrange data in a meaningful way.
Hand-wringing aside, I had a vision last week of something that might make for an interesting use of position: sticky: laying out company memberships over time in an InVision enterprise context. Within an InVision enterprise, users join and leave the enterprise over time using a startedAt and endedAt date/time-stamp. Within the current InVision UI (User Interface), it's easy to see who is currently a member of an enterprise; but, there's no way to see how users change over time, especially relative to each other.
If I could take the enterprise memberships and lay them out horizontally, with each user on a new line, it might give a better sense of how the enterprise organization has evolved over time:
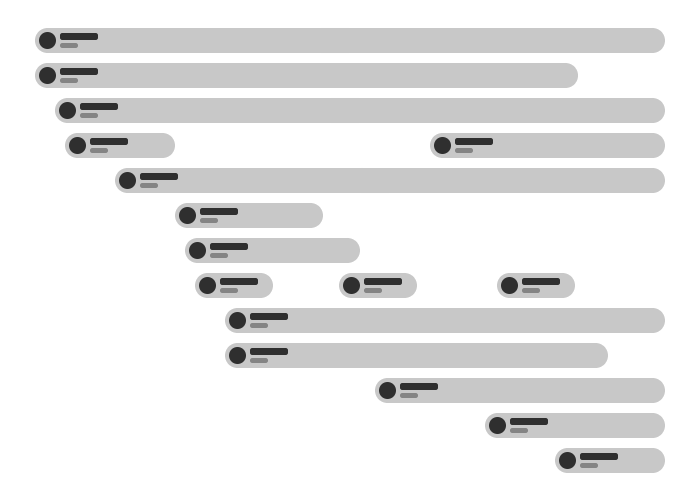
As you can see, we get a sort-of Gantt Chart of members, where each horizontal "segment" (ie, membership) starts with a user's avatar, name, and started-at / ended-at dates. Depending on the scale of this chart (that is, how days map to pixels on the screen), the width of the rendered chart may cause horizontal scrolling in the browser. In such a case, as the user is scrolling across each segment, we can use position: sticky to keep the user's information pinned to the side of the screen:
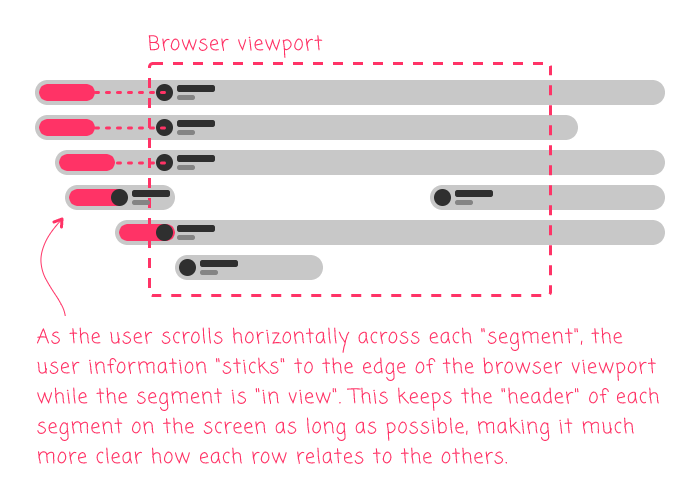
As you can see by way of the pink markers, the user's information floats right within the boundary of each segment such that it is pinned to the left-side of the viewport while there is sufficient wiggle-room within the given segment. By using this technique, we get as much "user data" in the viewport as possible at any given time.
The CSS for such a layout is basically as simple as:
.segment {}

.user {
	left: 0px ;
	position: sticky ;
}
The left: 0px tells the browser where to glue the user information relative to the viewport. In this case, we're asking the browser to glue it to the left-side of the viewport. And the 0px measurement determines how close to the edge the element is glued.
To experiment with this, I generated some sample company-membership data that includes started-at and ended-at date/times in UTC milliseconds:
var id = 0;

// Names generated with random name generator: http://random-name-generator.info/
export var membershipData = [
	{ userID: ++id, userName: "Elena Rodriguez", userInitials: "ER", startedAt: 1409620650000, endedAt: 1548271439000 },
	{ userID: ++id, userName: "Frederick Bishop", userInitials: "FB", startedAt: 1412792982000, endedAt: 0 },
	{ userID: ++id, userName: "Antonio Cummings", userInitials: "AC", startedAt: 1409620650000, endedAt: 0 },
	{ userID: ++id, userName: "Merle Love", userInitials: "ML", startedAt: 1409620650000, endedAt: 1514908369000 },
	{ userID: ++id, userName: "Ernesto Alexander", userInitials: "EA", startedAt: 1409620676000, endedAt: 0 },
	{ userID: ++id, userName: "Benjamin Goodwin", userInitials: "BG", startedAt: 1409620650000, endedAt: 0 },
	{ userID: ++id, userName: "Roger Floyd", userInitials: "RF", startedAt: 1409620650000, endedAt: 1445459651000 },
	{ userID: ++id, userName: "Leonard Fletcher", userInitials: "LF", startedAt: 1443474955000, endedAt: 1523833617000 },
	{ userID: id, userName: "Leonard Fletcher", userInitials: "LF", startedAt: 1545170239000, endedAt: 0 },
	{ userID: ++id, userName: "Vernon Barnes", userInitials: "VB", startedAt: 1409620650000, endedAt: 1438962131000 },
	{ userID: ++id, userName: "Amelia Wagner", userInitials: "AW", startedAt: 1409620650000, endedAt: 0 },
	// .... truncated ....
};
Then, I took that user-membership data and translated it into a "Timeline" data-structure in which each "track" in the timeline represents a user; and, each "segment" within a "track" represents a unique membership. Note that a user can leave and re-join a company over time, allowing each track to have 1..N non-overlapping segments:
interface User {
	id: number;
	name: string;
	initials: string;
	memberships: Membership[]
}

interface Membership {
	startedAt: number;
	endedAt: number;
}

interface Timeline {
	startedAt: number;
	endedAt: number;
	duration: number;
	durationInPixels: number;
	tracks: Track[];
}

interface Track {
	user: User;
	segments: Segment[];
}

interface Segment {
	membership: Membership;
	duration: number;
	durationInPixels: number;
	durationInPercent: number;
	offset: number;
	offsetInPixels: number;
	offsetInPercent: number;
}
As you can see, each Type definition here contains "InPixels" or "InPercent" values. These are being used to map the user-memberships onto the screen. The memberships are defined in terms of UTC milliseconds. But, the screen is defined in pixels. As such, we have to map one unit onto the other. And, as we zoom into/out of the chart, we have to adjust how those mappings are calculated (which will be based on a zoom-level).
Here's my App component, which is where all the maths take place. This component doesn't do much: it really just translates user-memberships onto Timeline constructs; and then, updates the "InPixels" calculation as we zoom in / out:
// Import the core angular services.
import { Component } from "@angular/core";
import { formatDate } from "@angular/common";
import { Inject } from "@angular/core";
import { LOCALE_ID } from "@angular/core";

// Import the application components and services.
import { membershipData } from "./data";

// ----------------------------------------------------------------------------------- //
// ----------------------------------------------------------------------------------- //

interface User {
	id: number;
	name: string;
	initials: string;
	memberships: Membership[]
}

interface Membership {
	startedAt: number;
	endedAt: number;
}

interface Timeline {
	startedAt: number;
	endedAt: number;
	duration: number;
	durationInPixels: number;
	tracks: Track[];
}

interface Track {
	user: User;
	segments: Segment[];
}

interface Segment {
	membership: Membership;
	duration: number;
	durationInPixels: number;
	durationInPercent: number;
	offset: number;
	offsetInPixels: number;
	offsetInPercent: number;
}

interface DateLabels {
	[ key: string ]: string;
}

// Rough constants for the number of milliseconds within a larger time-frame.
var DAY_MILLISECONDS = ( 1000 * 60 * 60 * 24 );
var MONTH_MILLISECONDS = ( DAY_MILLISECONDS * 30 );
var YEAR_MILLISECONDS = ( DAY_MILLISECONDS * 365 );

@Component({
	selector: "app-root",
	styleUrls: [ "./app.component.less" ],
	templateUrl: "./app.component.html"
})
export class AppComponent {

	public dateLabels: DateLabels;
	public timeline: Timeline;
	public users: User[];
	public zoomLevel: number;

	private localID: string;
	private zoomLevels: number[];

	// I initialize the app component.
	constructor( @Inject( LOCALE_ID ) localID: string ) {

		this.localID = localID;
		this.users = this.compileUserData();
		this.dateLabels = Object.create( null );

		// Lower levels are "zoomed out", higher levels are "zoomed in".
		this.zoomLevel = 3;
		this.zoomLevels = [
			( 1000 / ( YEAR_MILLISECONDS * 3 ) ),  // 1,000 px = 3 year
			( 1000 / ( YEAR_MILLISECONDS * 2 ) ),  // 1,000 px = 2 year
			( 1000 / ( YEAR_MILLISECONDS * 1 ) ),  // 1,000 px = 1 year
			( 1000 / ( MONTH_MILLISECONDS * 6 ) ), // 1,000 px = 6 months
			( 1000 / ( MONTH_MILLISECONDS * 3 ) ), // 1,000 px = 3 months
			( 1000 / ( MONTH_MILLISECONDS * 1 ) )  // 1,000 px = 1 month
		];

		this.timeline = {
			startedAt: 0,
			endedAt: 0,
			duration: 0,
			durationInPixels: 0,
			tracks: []
		};

		this.setDateLabels();
		this.setTimeline();

	}

	// ---
	// PUBLIC METHODS.
	// ---

	// I zoom-into the timeline so that time-frames appear longer.
	public zoomIn() : void {

		if ( this.zoomLevel < ( this.zoomLevels.length - 1 ) ) {

			this.zoomLevel++;
			this.updateTimelineZoom();

		}

	}


	// I zoom-out of the timeline so that time-frames appear shorter.
	public zoomOut() : void {

		if ( this.zoomLevel > 0 ) {

			this.zoomLevel--;
			this.updateTimelineZoom();

		}

	}

	// ---
	// PRIVATE METHODS.
	// ---

	// I compile the user date into our user view-model.
	private compileUserData() : User[] {

		var users: User[] = [];
		var user: User | null = null;

		// NOTE: We know that this sample user data has already been sorted first by
		// userID and then by startedAt / endedAt dates. As such, we know that the same
		// userID may be encountered multiples times in a row, indicating that the user
		// has left and then re-joined the company over time.
		for ( var membership of membershipData ) {

			if ( ! user || ( user.id !== membership.userID ) ) {

				user = {
					id: membership.userID,
					name: membership.userName,
					initials: membership.userInitials,
					memberships: []
				};
				users.push( user );

			}

			user.memberships.push({
				startedAt: membership.startedAt,
				endedAt: membership.endedAt
			});

		}

		// Our raw data was sorted by User (so that we could more easily group
		// memberships next to each other). However, now that we've parsed the raw data,
		// let's re-sorted with the oldest memberships first.
		users.sort(
			( a, b ) => {

				// NOTE: We know that ever use has at least one membership. As such, we
				// don't have to worry about checking lengths in this comparison.
				return( a.memberships[ 0 ].startedAt - b.memberships[ 0 ].startedAt );

			}
		);

		return( users );

	}


	// I scale the given milliseconds into rendered pixels based on the current zoom.
	private scaleMilliseconds( value: number ) : number {

		return( value * this.zoomLevels[ this.zoomLevel ] );

	}


	// I populate the date-labels view-model based on the current users.
	private setDateLabels() : void {

		for ( var user of this.users ) {
			for ( var membership of user.memberships ) {

				this.dateLabels[ membership.startedAt ] = formatDate( membership.startedAt, "mediumDate", this.localID );
				this.dateLabels[ membership.endedAt ] = formatDate( membership.endedAt, "mediumDate", this.localID );

			}
		}

		// An "endedAt" of "0" means that the given membership is still active (ie, not
		// actually ended). In that case, we'll translate the date to a string literal.
		this.dateLabels[ 0 ] = "Today";

	}


	// I populate the timeline view-model based on the current users.
	private setTimeline() : void {

		var minStartedAt = 0;
		var maxEndedAt = 0;
		var tickCount = Date.now();

		for ( var user of this.users ) {
			for ( var membership of user.memberships ) {

				minStartedAt = ( minStartedAt || membership.startedAt );
				minStartedAt = Math.min( minStartedAt, membership.startedAt );
				maxEndedAt = ( maxEndedAt || membership.endedAt || tickCount );
				maxEndedAt = Math.max( maxEndedAt, ( membership.endedAt || tickCount ) );

			}
		}

		this.timeline.duration = ( maxEndedAt - minStartedAt );
		this.timeline.durationInPixels = this.scaleMilliseconds( this.timeline.duration );

		this.timeline.tracks = this.users.map(
			( user ) => {

				var segments = user.memberships.map(
					( membership ) => {

						var offset = ( membership.startedAt - minStartedAt );
						var duration = ( ( membership.endedAt || tickCount ) - membership.startedAt );

						return({
							membership: membership,
							duration: duration,
							durationInPixels: this.scaleMilliseconds( duration ),
							durationInPercent: ( duration / this.timeline.duration * 100 ),
							offset: offset,
							offsetInPixels: this.scaleMilliseconds( offset ),
							offsetInPercent: ( offset / this.timeline.duration * 100 )
						});

					}
				);

				return({
					user: user,
					segments: segments
				});

			}
		);

	}


	// I update the scaled pixel values based on the current timeline and zoom level.
	private updateTimelineZoom() : void {

		this.timeline.durationInPixels = this.scaleMilliseconds( this.timeline.duration );

		for ( var track of this.timeline.tracks ) {
			for ( var segment of track.segments ) {

				segment.durationInPixels = this.scaleMilliseconds( segment.duration );
				segment.offsetInPixels = this.scaleMilliseconds( segment.offset );

			}
		}

	}

}
The HTML template for this component is also fairly straightforward. The nested data structures of the Timeline interface are translated into nested DOM (Document Object Model) elements. The scaled durations are then used to position and size each Segment within its own Track:
NOTE: This demo includes dragging behaviors as well as a Map. That said, I'm not going to showcase those in this demo since they weren't really the point - they were just a little rabbit-hole that I went down when trying to make this experience more interesting. If you are curious, you can look in the GitHub repository for this demo.
<bn-draggable-block
class="timeline"
[style.width.px]="timeline.durationInPixels">
<!-- BEGIN: Track. -->
<div *ngFor="let track of timeline.tracks" class="track">
<!-- BEGIN: Segment. -->
<div
*ngFor="let segment of track.segments"
class="segment"
[style.left.%]="segment.offsetInPercent"
[style.width.%]="segment.durationInPercent">
<!-- BEGIN: User Chip. -->
<div
class="user"
[class.user--active]="( ! segment.membership.endedAt )"
[style.max-width.px]="segment.durationInPixels">
<span class="user__initials">
{{ track.user.initials }}
</span>
<span class="user__info">
<span class="user__name">
{{ track.user.name }}
</span>
<span class="user__dates">
{{ dateLabels[ segment.membership.startedAt ] }}
→
{{ dateLabels[ segment.membership.endedAt ] }}
</span>
</span>
</div>
<!-- END: User Chip. -->
</div>
<!-- END: Segment. -->
</div>
<!-- END: Track. -->
</bn-draggable-block>
<div class="zoom">
<button (click)="zoomOut()" class="zoom__action">
Zoom out
</button>
<span class="zoom__level">
<!-- Adding "1" to make it more human-friendly. -->
{{ ( zoomLevel + 1 ) }}
</span>
<button (click)="zoomIn()" class="zoom__action">
Zoom in
</button>
</div>
<bn-timeline-map
[timeline]="timeline"
class="map">
</bn-timeline-map>
One thing you may notice here is that I have to include a max-width style on the user information within the segment:
[style.max-width.px]="segment.durationInPixels"
This is because you cannot combine position: sticky with overflow: hidden. When you attempt to clip the content of a container, it prevents sticky behaviors within that container (see GitHub issue). To cope with this, I add the max-width to the user information element and then clip that element instead.
Now, when we render this Angular 11 application in the browser and attempt to scroll horizontally, we get the following sticky situation!
How cool is that! As you can see, each user info element is sticking to the left-side of the browser viewport while the parent element is in view (and has sufficient space to allow for the stickiness). There's a lot more that could be done to this demo in order to create a better information experience; but, using the position: sticky within each segment gives us a lot of mileage!
Over the last few years, the web development community has been granted access to a lot of new CSS and JavaScript features that greatly reduce the amount of code that we have to write explicitly. This, in turn, leads to more stable, more performant experiences for our users. I am looking forward to using position: sticky more and more in my Angular applications.
Want to use code from this post? Check out the license.

Reader Comments
Really great blog! Especially the Angular examples are really helpful and great. Please keep on rolling!
@Code,
Thank you so much -- I'm really glad you like it. I love Angular - it just makes development so much fun!
@All,
I just learned about a CSS pseudo-class called
:target. I had never heard of this before, but it can be used to match an elements whoseidattribute matches the URL fragment / hash. I wanted to revisit this "timeline" demo using that CSS:www.bennadel.com/blog/3970-using-css-target-pseudo-class-to-toggle-element-display.htm
It's a very different take on the experience; but, it uses no JavaScript at all.