The Hope Of Using JVM Metrics To Drive The Readiness Check In Kubernetes (K8) And ColdFusion
Earlier this week, I looked at how you can measure JVM metrics like CPU load, garbage collection times, and thread state in ColdFusion. Normally, this kind of measurement is performed implicitly by Java agents like FusionReactor. But, in the world of Kubernetes (K8), I had hoped that such metrics could actually be used to programmatically drive the logic of the "readiness check" - the Kubernetes construct that determines whether or not a ColdFusion pod should remain in active load-balancer rotation. The reality is, I never quite figured it out - I never had enough confidence to pull the trigger on dynamically taking pods out of rotation. But, it was certainly an interesting experiment; and, I think one worth sharing.
CAUTION: I am a novice when it comes to Kubernetes (K8); so, please forgive me if anything I say in this article isn't quite accurate. I feel like I understand the most basic concepts; but, I my understanding is only skin-deep.
When you use Kubernetes to manage the availability of ColdFusion pods in a load balancer, there are two checks that ColdFusion has to provide:
Liveness Check - This determines if the ColdFusion application is in a fundamentally healthy state. If this check fails, the ColdFusion pod will be killed and re-created.
Readiness Check - This determines if the ColdFusion application is healthy enough to process incoming user traffic. If this check fails, the ColdFusion pod is taken out of HTTP rotation, but is kept alive in the hope that it will return to a healthy state. Once the Readiness check succeeds, the newly-healthy pod will be returned to active HTTP rotation.
Part of the reason that I was measuring all of the JVM metrics that I discussed in my previous post was the hope that I could observe trends in the JVM health and use those trends to power the K8 readiness probe. Now, to be clear, I never figured out how to do that. But, measuring the JVM health in the K8 readiness check did give me a ton of insight into how the ColdFusion pods were performing.
The K8 readiness check runs every 10-seconds in our configuration. My basic plan was to use that 10-second internal to both trigger asynchronous measurements of the JVM and to respond to the previous recordings of those measurements.
I took care to measure the JVM asynchronously because I didn't want to block the readiness check in any way. Part of the K8 configuration determines how long K8 will wait for one of the checks to return. So, I wanted to ensure that the very act of trying to Observe the system didn't accidentally signal that the system was unhealthy.
The core method of my ColdFusion readiness check implementation looks like this:
/**
* I run the readiness check and return a True / False value indicating whether or not
* the pod should be kept in rotation (True = Keep pod in rotation, False = remove pod
* from rotation).
*
* NOTE: It is expected that this method is being called on a REGULAR INTERVAL (via
* Kubernetes). As such, it will be running introspection asynchronously and then
* integrating data when it becomes available.
*
* @output false
*/
public boolean function run() {

	// The challenge with the readiness check is that we don't want to BLOCK the
	// request or cause it to ERROR OUT. Kubernetes is looking for a 200 OK response
	// that is returned in a very limited amount of time (configurable in K8). As
	// such, if the readiness check takes too long, or throws an error, it may cause
	// the pod to be taken out of rotation accidentally. To cope with this, all of
	// the following checks will be run asynchronously (ie, in a non-blocking
	// manner). Which means, all data collected now will need to be applied during a
	// subsequent readiness check.
	// --
	// NOTE: We need to trigger the measurements BEFORE we check to see if the pod is
	// taken out of rotation, otherwise it will never have a chance to be put back
	// into rotation once it is deemed unhealthy.
	runSafelyAsync( "measureCpuLoad" );
	runSafelyAsync( "measureGcLoad" );
	runSafelyAsync( "measureMemoryUsage" );
	runSafelyAsync( "measureThreadUsage" );

	// If the pod appears unhealthy, an engineer can explicitly ask the pod (via a
	// feature flag) to start reporting a thread-dump during the check execution.
	// --
	// CAUTION: This may add additional stress to an already unhealthy pod. As such,
	// it should only be done for brief period of time. Adding rate-limit logic would
	// also be a valuable option.
	if ( shouldReportThreadDump() ) {

		runSafelyAsync( "measureThreadStack" );

	}

	// Now that we've triggered all of our asynchronous introspection, let's check to
	// see if the pod should be failed-out of rotation because it has been identified
	// as unhealthy BY ONE OF THE ENGINEERS (using a feature flag). This is basically
	// an "emergency brake" that the engineers can pull to stop sending HTTP traffic
	// to this pod.
	if ( shouldStopReceivingHttpTraffic() ) {

		return( false );

	}

	// If the pod isn't being killed explicitly by the engineers, let's check to see
	// if it should be taken out of rotation because it is unhealthy (based on
	// introspection data that has been gathered as part of the the previous
	// readiness check executions).
	if ( shouldFailReadinessCheck() ) {

		return( false );

	}

	// If we made it this far, we have no reason to fail this pod out of rotation.
	return( true );

}
Basically, every 10-seconds, my Kubernetes readiness check would spawn asynchronous measurements of the JVM; then, check to see if the previous measurements indicated an unhealthy pod. If this method returns false, the ColdFusion controller (not shown in this demo), would return a 503 Service Unavilable response. Kubernetes would then, in turn, prevent this instance of the ColdFusion application from receiving HTTP traffic.
All of the measureXYZ methods are run inside an asynchronous cfthread body that uses try/catch blocks in order to ensure that the readiness check never fails based on unexpected errors. It also uses a cflock to syncrhonize overlapping calls such that they don't overburden the system.
The measurement methods do two things: they log DogStatsD metrics for DataDog time-series graphs; and they store those metrics in memory so that they can be used to determine pod health. Because the measurements are being performed asynchronously, it means that access to the in-memory metrics presents a race-condition between the page thread and the measurement threads. In order to manage this race-conditions I am using Java's Atomic data types in lieu of named-locks.
With that said, here's the full code for my Kubernetes (K8) readiness check in ColdFusion:
component
	output = false
	hint = "I provide the Kubernetes (K8) Readiness check implementation."
	{

	/**
	* I initialize the Kubernetes (K8) Readiness check implementation. This readiness
	* check measures the underlying JVM state and uses that state to [one day] determine
	* if the pod is healthy and prepared to handle incoming HTTP traffic.
	*
	* @dogStatsD I provide a statsD implementation that supports tagging.
	* @featureFlags I provide a feature flag implementation.
	* @jvmHelper I provide access to lower-level JVM metrics.
	* @logger I provide a logging implementation.
	* @output false
	*/
	public any function init(
		required any dogStatsD,
		required any featureFlags,
		required any jvmHelper,
		required any logger
		) {

		variables.dogStatsD = dogStatsD;
		variables.featureFlags = featureFlags;
		variables.jvmHelper = jvmHelper;
		variables.logger = logger;

		// Feature flags and StatsD metrics in this readiness check are driven by host
		// name. This allows us to target this machine specifically.
		variables.hostName = getHostName();

		// As the readiness check executes, it both reads from and writes to a snapshot
		// of JVM metrics. In order to allow for this multi-access pattern without an
		// explicit set of locks, we're going to use ATOMIC values. These are simple data
		// points that provide inherent and efficient locking under the hood.
		// --
		// NOTE: The challenging part of this snapshot creation is that we have to know
		// the property names ahead of time. Unfortunately, the property names are not
		// 100% consistent when it comes to GARBAGE COLLECTION (GC) since the underlying
		// MX Beans change depending on which GC algorithms are in place. As such, the
		// names you use here will have to change with your JVM configuration. Since I am
		// authoring this demo in CommandBox / Lucee, I know (from experimentation) that
		// the GC algorithms use "PS Scavenge" and "PS MarkSweep".
		variables.snapshot = {
			"jvm.cpu.process": newSnapshotProperty(),
			"jvm.cpu.system": newSnapshotProperty(),
			// -- These are JVM-configuration-specific names:
			"jvm.gc.psScavenge": newSnapshotProperty(),
			"jvm.gc.psMarkSweep": newSnapshotProperty(),
			// --
			"jvm.memory.heap.max": newSnapshotProperty(),
			"jvm.memory.heap.committed": newSnapshotProperty(),
			"jvm.memory.heap.used": newSnapshotProperty(),
			"jvm.memory.nonHeap.max": newSnapshotProperty(),
			"jvm.memory.nonHeap.committed": newSnapshotProperty(),
			"jvm.memory.nonHeap.used": newSnapshotProperty(),
			"jvm.threads.all": newSnapshotProperty(),
			"jvm.threads.daemon": newSnapshotProperty(),
			"jvm.threads.blocked": newSnapshotProperty(),
			"jvm.threads.new": newSnapshotProperty(),
			"jvm.threads.runnable": newSnapshotProperty(),
			"jvm.threads.terminated": newSnapshotProperty(),
			"jvm.threads.timedWaiting": newSnapshotProperty(),
			"jvm.threads.waiting": newSnapshotProperty()
		};

	}

	// ---
	// PUBLIC METHODS.
	// ---

	/**
	* I run the readiness check and return a True / False value indicating whether or not
	* the pod should be kept in rotation (True = Keep pod in rotation, False = remove pod
	* from rotation).
	*
	* NOTE: It is expected that this method is being called on a REGULAR INTERVAL (via
	* Kubernetes). As such, it will be running introspection asynchronously and then
	* integrating data when it becomes available.
	*
	* @output false
	*/
	public boolean function run() {

		// The challenge with the readiness check is that we don't want to BLOCK the
		// request or cause it to ERROR OUT. Kubernetes is looking for a 200 OK response
		// that is returned in a very limited amount of time (configurable in K8). As
		// such, if the readiness check takes too long, or throws an error, it may cause
		// the pod to be taken out of rotation accidentally. To cope with this, all of
		// the following checks will be run asynchronously (ie, in a non-blocking
		// manner). Which means, all data collected now will need to be applied during a
		// subsequent readiness check.
		// --
		// NOTE: We need to trigger the measurements BEFORE we check to see if the pod is
		// taken out of rotation, otherwise it will never have a chance to be put back
		// into rotation once it is deemed unhealthy.
		runSafelyAsync( "measureCpuLoad" );
		runSafelyAsync( "measureGcLoad" );
		runSafelyAsync( "measureMemoryUsage" );
		runSafelyAsync( "measureThreadUsage" );

		// If the pod appears unhealthy, an engineer can explicitly ask the pod (via a
		// feature flag) to start reporting a thread-dump during the check execution.
		// --
		// CAUTION: This may add additional stress to an already unhealthy pod. As such,
		// it should only be done for brief period of time. Adding rate-limit logic would
		// also be a valuable option.
		if ( shouldReportThreadDump() ) {

			runSafelyAsync( "measureThreadStack" );

		}

		// Now that we've triggered all of our asynchronous introspection, let's check to
		// see if the pod should be failed-out of rotation because it has been identified
		// as unhealthy BY ONE OF THE ENGINEERS (using a feature flag). This is basically
		// an "emergency brake" that the engineers can pull to stop sending HTTP traffic
		// to this pod.
		if ( shouldStopReceivingHttpTraffic() ) {

			return( false );

		}

		// If the pod isn't being killed explicitly by the engineers, let's check to see
		// if it should be taken out of rotation because it is unhealthy (based on
		// introspection data that has been gathered as part of the the previous
		// readiness check executions).
		if ( shouldFailReadinessCheck() ) {

			return( false );

		}

		// If we made it this far, we have no reason to fail this pod out of rotation.
		return( true );

	}


	/**
	* I determine if the current pod should be failed out of rotation because it appears
	* to be unhealthy as defined by the data that has been discovered during previous
	* introspection of the JVM and surrounding systems.
	*
	* @output false
	*/
	public boolean function shouldFailReadinessCheck() {

		// #SadPanda

		// TO BE HONEST, I COULD NEVER FIGURE THIS PART OUT. This is the part of the
		// readiness check that was - THEORETICALLY - going to consume the snapshot data
		// and then determine if the pod should be taken out of rotation (ie, removed
		// from the load balancer). For example, if the number of BLOCKED THREADS was
		// really high; or, if the GARBAGE COLLECTION CPU load was through the roof;
		// then, maybe I could tell the pod to be taken out of the load balancer. But, I
		// just NEVER FELT CONFIDENT TAKING ACTION here.

		// Also, the usage patterns were very different right after the pod was brought
		// online vs. 10-minutes later. So, for example, there is a spike in blocked
		// threads and GC right after the pod is born; but, I know that this happens; so,
		// I didn't want to kill the pod prematurely.

		// Hopefully, at the very least, this code sparks some better ideas in others :D
		// If nothing else, I was able to leverage the Kubernetes readiness check to
		// chart the JVM healthy quite easily with DogStatsD.

		return( false );

	}


	/**
	* I determine if the current pod should start reporting thread dumps.
	*
	* @output false
	*/
	public boolean function shouldReportThreadDump() {

		return( featureFlags.getVariation( hostName, "OPERATIONS-report-thread-dump" ) );

	}


	/**
	* I determine if the current pod should stop receiving HTTP traffic. This is based
	* on an EXPLICIT REQUEST from the engineers, not logic based on the pod health.
	*
	* @output false
	*/
	private boolean function shouldStopReceivingHttpTraffic() {

		return( featureFlags.getVariation( hostName, "OPERATIONS-stop-http-traffic" ) );

	}

	// ---
	// PRIVATE METHODS.
	// ---

	/**
	* I return the hostname of the current machine.
	*
	* @output false
	*/
	private string function getHostName() {

		var inetAddress = createObject( "java", "java.net.InetAddress" );

		return( lcase( inetAddress.getLocalHost().getHostName() ) );

	}


	/**
	* I measure the CPU load of the JVM and the host machine.
	*
	* @output false
	*/
	private void function measureCpuLoad() {

		recordMeasurement( "jvm.cpu.process", jvmHelper.getCpuLoad() );
		recordMeasurement( "jvm.cpu.system", jvmHelper.getCpuLoadForSystem() );

	}


	/**
	* I measure the Garbage Collection (GC) load of the JVM.
	*
	* @output false
	*/
	private void function measureGcLoad() {

		var gcStats = jvmHelper.getGcStats();

		// CAUTION: These keys are not the same for every JVM configuration. They are
		// dependent on the type of Garbage Collection algorithm that you have in place.
		// As such, you will have to change this logic here if / when you change your GC
		// settings. But, to be safe, I am testing the keys before I consume them.
		var gcMapping = {
			"PS Scavenge": "jvm.gc.psScavenge",
			"PS MarkSweep": "jvm.gc.psMarkSweep"
		};

		for ( var key in gcMapping ) {

			if ( structKeyExists( gcStats, key ) ) {

				recordMeasurement( gcMapping[ key ], gcStats[ key ] );

			}

		}

	}


	/**
	* I measure the memory usage of the JVM.
	*
	* @output false
	*/
	private void function measureMemoryUsage() {

		var heapUsage = jvmHelper.getMemoryUsageForHeap();

		recordMeasurement( "jvm.memory.heap.max", heapUsage.max );
		recordMeasurement( "jvm.memory.heap.committed", heapUsage.committed );
		recordMeasurement( "jvm.memory.heap.used", heapUsage.used );

		var nonHeapUsage = jvmHelper.getMemoryUsageForNonHeap();

		recordMeasurement( "jvm.memory.nonHeap.max", nonHeapUsage.max );
		recordMeasurement( "jvm.memory.nonHeap.committed", nonHeapUsage.committed );
		recordMeasurement( "jvm.memory.nonHeap.used", nonHeapUsage.used );

	}


	/**
	*I measure the thread stack of the JVM.
	*
	* @output false
	*/
	private void function measureThreadStack() {

		logger.threadDump( jvmHelper.getThreadDump() );

	}


	/**
	* I measure the thread usage of the JVM.
	*
	* @output false
	*/
	private void function measureThreadUsage() {

		var threadStats = jvmHelper.getThreadStats();

		recordMeasurement( "jvm.threads.all", threadStats.all );
		recordMeasurement( "jvm.threads.daemon", threadStats.daemon );
		recordMeasurement( "jvm.threads.blocked", threadStats.blocked );
		recordMeasurement( "jvm.threads.new", threadStats.new );
		recordMeasurement( "jvm.threads.runnable", threadStats.runnable );
		recordMeasurement( "jvm.threads.terminated", threadStats.terminated );
		recordMeasurement( "jvm.threads.timedWaiting", threadStats.timed_waiting );
		recordMeasurement( "jvm.threads.waiting", threadStats.waiting );

	}


	/**
	* I create and return a new ATOMIC data structure for use in the snapshot.
	*
	* @output false
	*/
	private any function newSnapshotProperty() {

		return( createObject( "java", "java.util.concurrent.atomic.AtomicLong" ).init() );

	}


	/**
	* I record the given measurement to the Snapshot, and to StatsD.
	*
	* @snapshotKey I am the snapshot property being recorded.
	* @snapshotValue I am the value being applied.
	* @output false
	*/
	private void function recordMeasurement(
		required string snapshotKey,
		required numeric snapshotValue
		) {

		// Record the value to the readiness check snapshot.
		snapshot[ snapshotKey ].set( javaCast( "long", snapshotValue ) );

		// Record the value to DogStatsD so that we can graph it in DataDog. This will
		// help us see and understand the patterns over time so that we can fine-tune the
		// logic that pulls the pod out of rotation based on snapshot trends.
		dogStatsD.gauge(
			key = snapshotKey,
			value = snapshotValue,
			tags = [ "pod_name:#hostName#" ]
		);

	}


	/**
	* I run the given method asynchronously and single-threaded.
	*
	* @methodName I am the method being invoked asynchronously.
	* @output false
	*/
	private void function runSafelyAsync( required string methodName ) {

		try {

			// We're going to run the given method inside an asynchronous thread.
			thread
				name = "ReadinessCheck.runSafelyAsync.#methodName#"
				action = "run"
				methodName = methodName
				{

				try {

					// We're going to run the given method as a synchronized operation.
					// Meaning, only one execution at a time. If another readiness check
					// happens to overlap with this one, we'll give it 1-second to wait
					// (the minimum wait time for a lock); and, if the lock cannot be
					// granted, then the current execution will just skip this block and
					// end the thread-execution gracefully.
					lock
						name = "ReadinessCheck.runSafelyAsync.#methodName#"
						type = "exclusive"
						timeout = 1
						throwOnTimeout = false
						{

						invoke( variables, methodName );

					}

				// If an error is thrown while executing the method, it will be missed by
				// the global error handler (since it is inside a CFThread). As such, we
				// have to trap and log these errors specifically.
				} catch ( any error ) {

					logger.error( error, "Error executing [#methodName#] in readiness check." );

				}

			}

		// If an error is thrown while trying to spawn a CFThread, it is because the
		// ColdFusion instance has run out of threads AND has maxed-out the thread queue.
		} catch ( any error ) {

			logger.error( error, "Unable to spawn cfthread in readiness check." );

		}

	}

}
Now, as I said before, I never actually got to the point where I used the JVM metrics to pull the pod out of rotation - at least not automatically; but, I definitely used the graphed metrics to remove pods explicitly via the OPERATIONS feature flag.
Every time this readiness check runs, it would report DogStatsD metrics, which I was able to turn into very pretty DataDog time-series graphs:
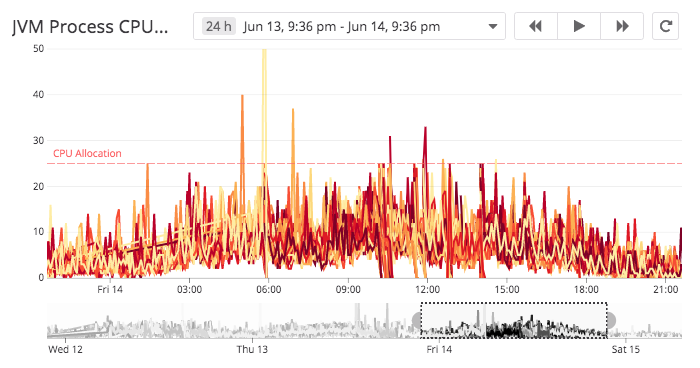
The nice thing about these graphs is that I am able to quickly spot a single pod - out of dozens - that is behaving abnormally. And, in DataDog, I can even set monitoring and alerting based on these values. So, while I never got to the point where I felt like I could take automatic action, I did get a lot of value out of measuring the JVM in the Kubernetes readiness check.
If nothing else, I think there's some interesting stuff here in regard to Atomic values and managing asynchronous actions. This code may seem straightforward enough; but, it actually took me several weeks of trial-and-error and refactoring to get to this point. Hopefully it was worth sharing.
Want to use code from this post? Check out the license.

Reader Comments
Thank you so much Ben!!
@Paolo,
Thank you, good sir. This is certainly something that has been quite challenging. In the "production version" of this ColdFusion component, I have quite a bit more logic that I am experimenting with. For example, I keep track of when the pod was brought online by keeping a date/time stamp in the constructor:
... then, I have another method that I can call to determine if the pod is in a "stable state". By that, I mean "has enough time passed that the turmoil of bootup is over. Something like:
... which basically says that if the ColdFusion application is greater than 5-mins old, it should be considered "Stable". At that point, I can [theoretically] be a bit more aggressive in how I consume things like CPU and memory allocation.
I say "theoretically", because I haven't really done it yet. I'm so afraid to accidentally pull all of the pods out of rotation :D But, that's the kind of direction my thinking is going.
Still lots of trial and error.