
Using CSS Flexbox To Create A Simple Bar Chart In ColdFusion
I'm a huge fan of CSS Flexbox layouts. They're relatively simple to use and there's not much to remember in terms of syntax. One place that I love using Flexbox is when I need to create a simple bar chart. I don't do much charting in my work, so I never have need to pull in large, robust libraries like D3. But, for simple one-off visualizations, CSS Flexbox is my jam. I thought it might be worth sharing a demo of how I do this in ColdFusion.
NOTE:: While this is a ColdFusion demo, I've saved a generated copy of the output into my JavaScript Demos GitHub repository (links below) in case anyone wants to poke around in the Chrome dev-tools.
Run this demo in my JavaScript Demos project on GitHub.
View this code in my JavaScript Demos project on GitHub.
First, let's just look at what kind of visual experience we're trying to create so that we can have a more contextual conversation. This is a randomly generated dataset of 12-months of data. The values are all generated using randRange( 1, 200 ):
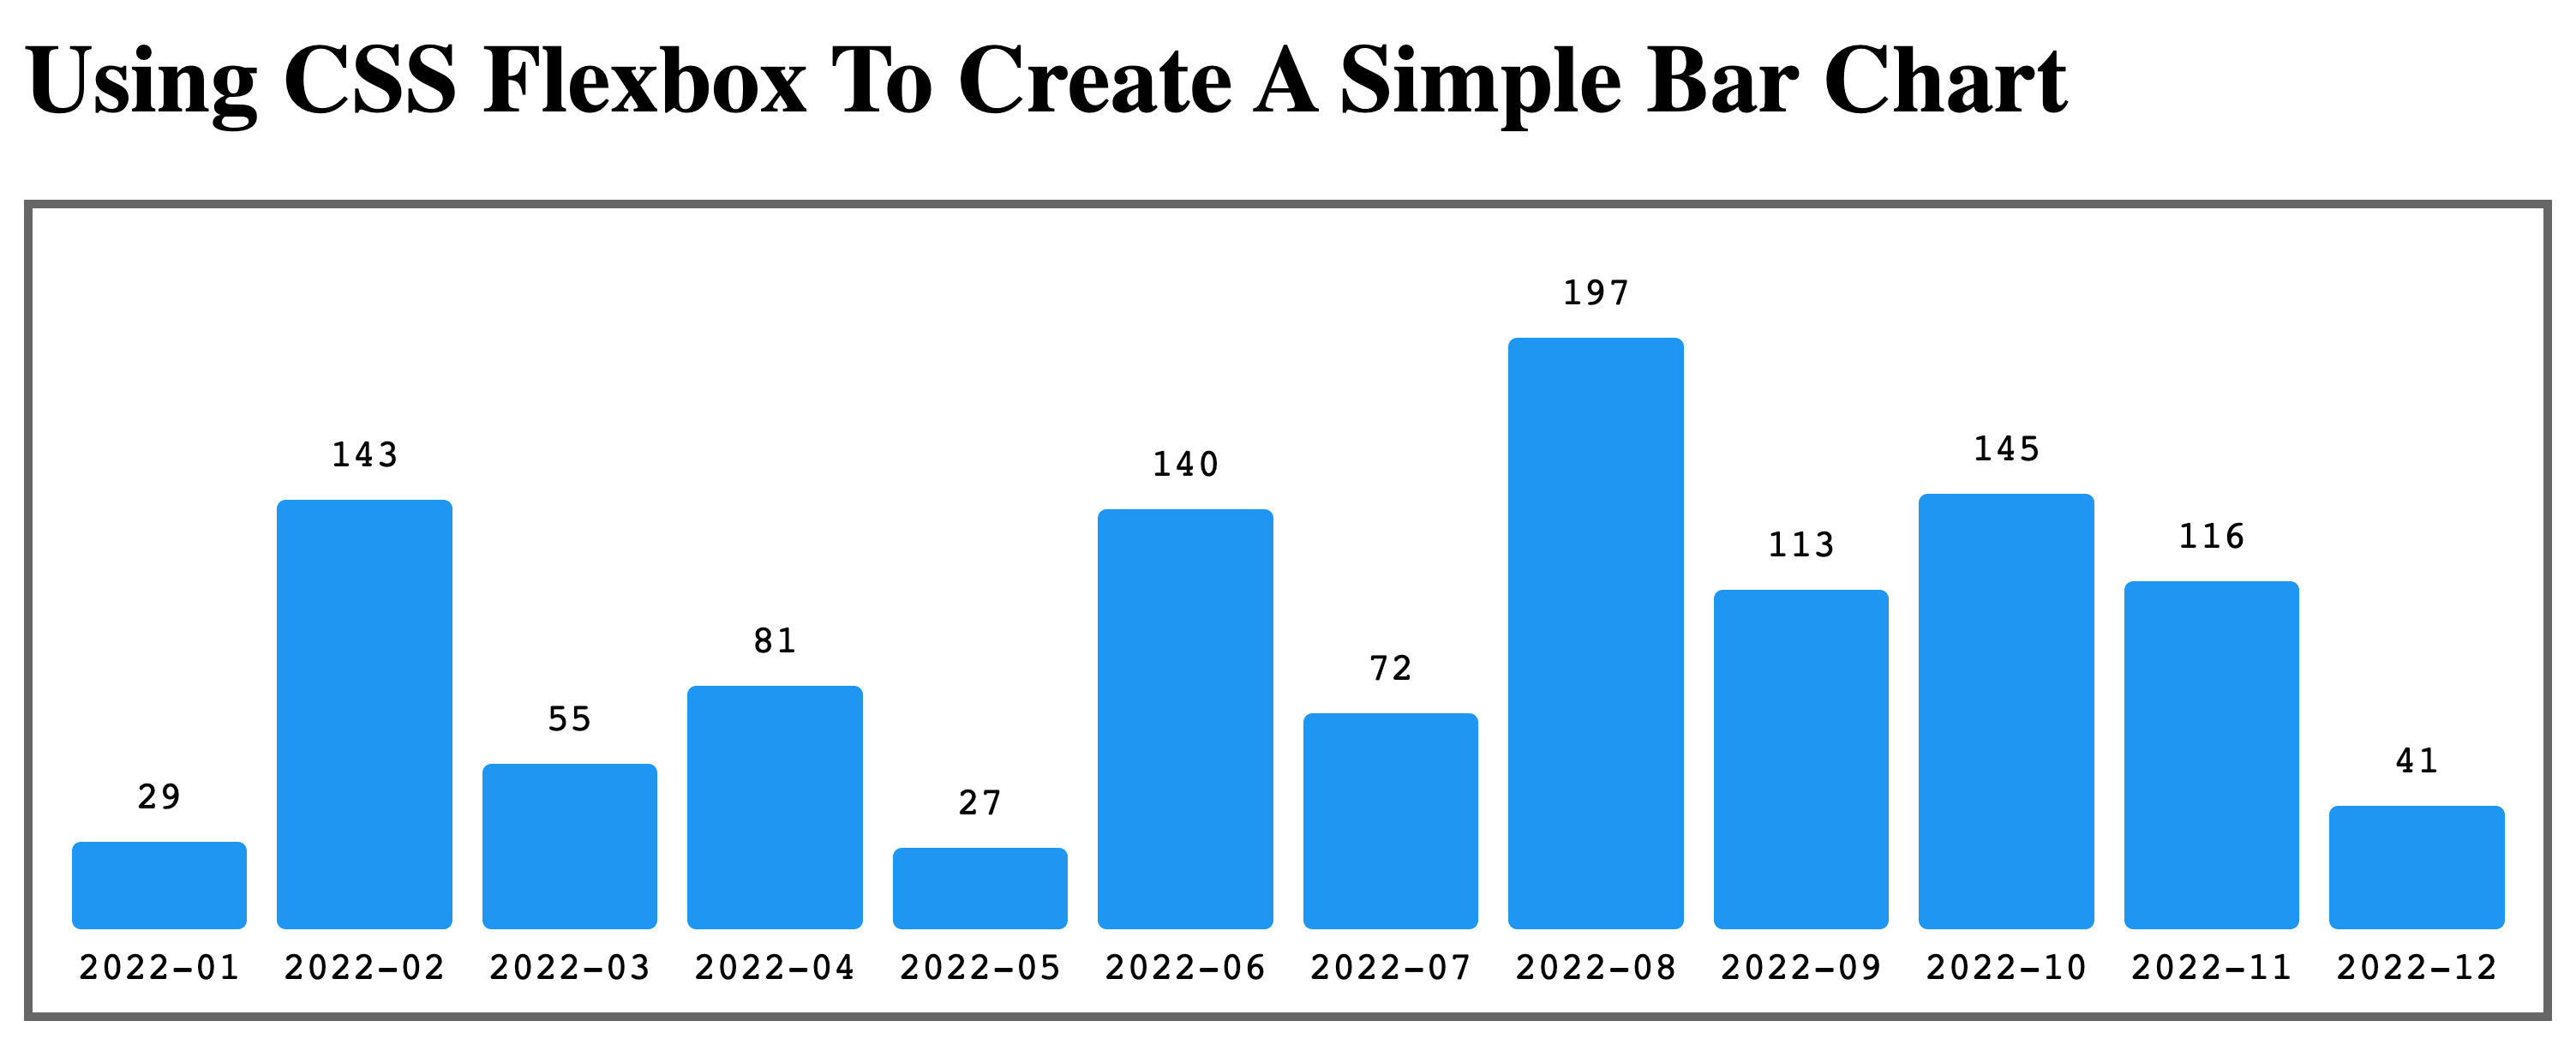
This bar chart is rendered using nested CSS Flexbox layouts:
Row Layout: The overall chart is rendered as a flexbox layout in the
rowdirection, which makes each entry an evenly-spaced item along the horizontal axis.Column Layout: Each entry within the chart is rendered as a flexbox layout in the
column-reversedirection, which makes the "value" and the "bar" float to the bottom of each entry in the vertical axis.
The "bar" height is then defined as an inline style attribute. Normally, in the ColdFusion code, I would do some sort of "scaling" to the values in order to make sure that they all fit inside a given visual area; but, for the sake of simplicity, I'm just using numbers that I know will fit.
Here's the ColdFusion and CSS markup for this demo:
<cfscript>

	readings = [
		{ label: "2022-01", value: randRange( 1, 200 ) },
		{ label: "2022-02", value: randRange( 1, 200 ) },
		{ label: "2022-03", value: randRange( 1, 200 ) },
		{ label: "2022-04", value: randRange( 1, 200 ) },
		{ label: "2022-05", value: randRange( 1, 200 ) },
		{ label: "2022-06", value: randRange( 1, 200 ) },
		{ label: "2022-07", value: randRange( 1, 200 ) },
		{ label: "2022-08", value: randRange( 1, 200 ) },
		{ label: "2022-09", value: randRange( 1, 200 ) },
		{ label: "2022-10", value: randRange( 1, 200 ) },
		{ label: "2022-11", value: randRange( 1, 200 ) },
		{ label: "2022-12", value: randRange( 1, 200 ) }
	];

</cfscript>
<!doctype html>
<html lang="en">
<head>
	<meta charset="utf-8" />
	<style type="text/css">

		/* The chart is a row-oriented flexbox container. */
		.chart {
			border: 3px solid #666666 ;
			display: flex ;
			font-family: monospace ;
			gap: 10px ;
			margin: 0px 0px 0px 0px ;
			padding: 10px 13px 8px 13px ;
		}
		/*
			Each reading in the chart is a column-oriented flexbox container. The items in
			this flexbox container are REVERSED so that the label renders at the bottom,
			visually, but is still the first element, semantically.
		*/
		.chart__reading {
			display: flex ;
			flex: 1 1 auto ;
			flex-direction: column-reverse ;
			gap: 5px ;
			height: 250px ;
			margin: 0px 0px 0px 0px ;
		}
		.chart__label {
			flex: 0 0 auto ;
			margin: 0px 0px 0px 0px ;
			text-align: center ;
		}
		.chart__value {
			flex: 0 0 auto ;
			margin: 0px 0px 0px 0px ;
			text-align: center ;
		}
		.chart__bar {
			background-color: #2196f3 ;
			border-radius: 3px 3px 3px 3px ;
			display: block ;
			margin-top: 8px ;
		}

	</style>
</head>
<body>
	<cfoutput>

		<h1>
			Using CSS Flexbox To Create A Simple Bar Chart
		</h1>

		<dl class="chart">
			<cfloop item="reading" array="#readings#">
				<!---
					NOTE: In modern HTML, it's valid to wrap each Description Term (DT)
					and its associated Description Details (DD) in a DIV. This gives us
					greater control over the rendering of the content.
				--->
				<div class="chart__reading">

					<dt class="chart__label">
						#encodeForHtml( reading.label )#
					</dt>

					<dd class="chart__value">
						#encodeForHtml( reading.value )#

						<!--- Visual rendering of the "bar". --->
						<span
							class="chart__bar"
							style="height: #reading.value#px ;">
						</span>
					</dd>

				</div>
			</cfloop>
		</dl>

	</cfoutput>

</body>
</html>
Is this the most robust bar char you've ever seen? Absolutely not. But, there's no JavaScript required and the layout is relatively simple to reason about. Bottom line is, CSS Flexbox is awesome and it makes life awesome!
Want to use code from this post? Check out the license.

Reader Comments
This is pretty great actually...and useful. I really DO NOT love CFChart. It feels way to cumbersome for most of my (minimal) charting needs and rarely gives me what I want. Instead, I find myself stopping at "good enough" and calling it a day.
@Chris,
Yeah, I haven't done much with CFChart in forever. Though, to also be fair, I don't generate too many graphs. I think I forgot that CFChart existed (I'm not even sure if it is supported in Lucee, which is what I use at work). It might be worth another look (for me).