
MySQL's Slow Query Log "start_time" Column Is Actually The "end" Time Of The Query
Earlier today, I examined an incident in which MySQL's MRR (Multi-Range Read) optimization inadvertently caused a partial database outage. Part of what made debugging the incident frustrating was the fact that the poorly-performing queries showed up in MySQL's slow_log table at the very end of the incident window despite the fact that they clearly started the incident. I have long suspected that the "start_time" column of the slow_log table was misleading; but, this past debugging session finally gave me the motivation to dig into the mechanics of the slow query log and build a better mental model for what the "start_time" column actually represents.
Testing the "start_time" column is fairly straightforward. All we have to do is run two SLEEP() queries back-to-back and see how the "start_time" is reported in the slow query log. Assuming that we use the following queries:
- SLEEP( 2 )
- SLEEP( 20 )
... if the "start_time" is the true initiation time of the queries, then the "start_time" for these two queries will be 2-seconds apart since the second query started 2-seconds after the first one. However, if the "start_time" column actually represents the "end" time or the "log" time, then these two queries will be 20-seconds apart since the second query finished 20-seconds after the first query finished.
-- Enable the slow query log (with a 1-second threshold) for this connection.
SET SESSION slow_query_log = 'ON';
SET SESSION log_output = 'TABLE';
SET SESSION long_query_time = 1;

-- Clear out any slow queries from previous tests.
TRUNCATE TABLE mysql.slow_log;

-- Both of these queries are going to exceed the slow-query threshold. If the
-- "start_time" column is the true start time, then these two queries will start
-- just 2-seconds apart (based on the first SLEEP). However, if the "start" time
-- is really the "end" time (or the "log" time), then these two queries will start
-- 20-seconds apart (based on the second SLEEP).
SELECT SLEEP( 2 ) AS v;
SELECT SLEEP( 20 ) AS v;

SELECT
	l.start_time,
	l.query_time,
	l.rows_sent,
	l.rows_examined,
	l.sql_text
FROM
	mysql.slow_log l
ORDER BY
	l.start_time ASC
;
As you can see, for this database connection, we're enabling the slow query log and we're setting its threshold to 1-second (the default is 10-seconds). This way, both of our SLEEP() queries will be captured. And, when we run this test in the database, we get the following output:
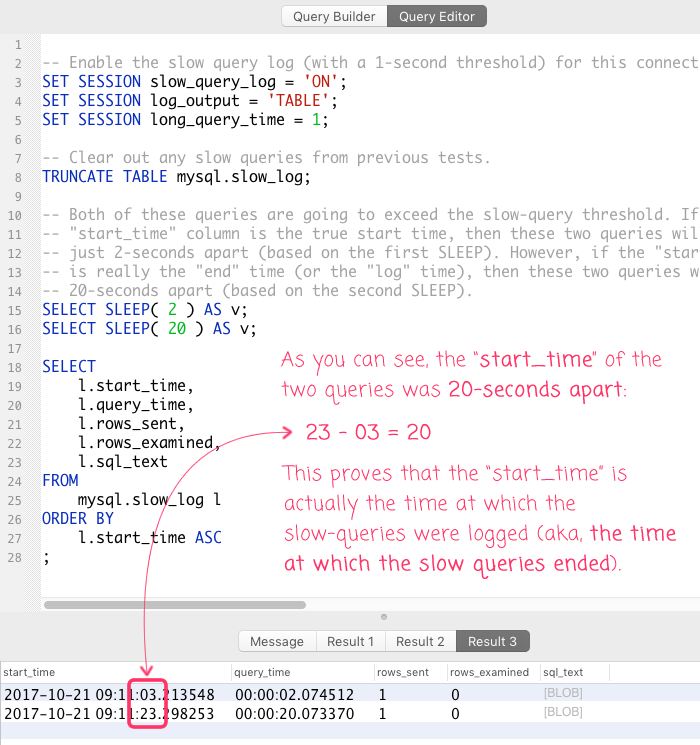
As you can see, the "start_time" of the two queries, as reported by MySQL's slow query log, is 20-seconds apart. This proves that the "start_time" is, in fact, the "end" time or the "log" time of the queries. This also explains why long-running queries that caused an incident wouldn't actually show up in the slow_log until much later in the incident's timeline.
Luckily, the slow_log table gives us both the "start_time" and the "query_time" columns. And, since the "query_time" represents the duration of the query execution, we can calculate the true "start" time of the query by subtracting the query_time from the reported start_time:
normalized_start_time = ( "start_time" - "query_time" )
At work, I use a time-boxed query to search through MySQL's slow query log so that I can look at queries during an incident window. Given this new insight into the meaning of the "start_time" column, I'm going to update my go-to debugging query to include a normalized start time. This way, I'll see slow queries in the order in which they were initiated, not in the order in which they returned:
-- Since the Database runs in UTC time, convert from EST to UTC so that I can input
-- dates using my local time-zone (helps to maintain sanity while debugging queries).
SET @startedAt = CONVERT_TZ( '2017-10-21 09:00:00', 'EST', 'UTC' );
SET @endedAt = CONVERT_TZ( '2017-10-21 09:59:00', 'EST', 'UTC' );

-- For daylight saving time ( use when ~ between MARCH and NOVEMBER ), uncomment the
-- following to adjust for accurate UTC.
SET @startedAt = DATE_ADD( @startedAt, INTERVAL -1 HOUR );
SET @endedAt = DATE_ADD( @endedAt, INTERVAL -1 HOUR );

SELECT
	DATE_FORMAT( ( l.start_time - l.query_time ), '%T' ) AS normalized_start_time,
	l.query_time,
	l.lock_time,
	l.rows_sent,
	l.rows_examined,
	l.sql_text,
	l.start_time
FROM
	mysql.slow_log l
WHERE
	l.start_time BETWEEN @startedAt AND @endedAt

-- When sorting the slow-queries, sort on the "normalized" start time so that very
-- long-running queries show up in the list at the start of an incident, not at the
-- end of the incident.
ORDER BY
	( l.start_time - l.query_time ) ASC
LIMIT
	5000
;
As you can see, I'm ordering the query based on the delta of the two columns ("start_time" and "query_time"):
ORDER BY ( l.start_time - l.query_time ) ASC
Then, in the SELECT clause, I'm formatting this delta as a nice, easy-to-read time-stamp:
DATE_FORMAT( ( l.start_time - l.query_time ), '%T' ) AS normalized_start_time
NOTE: The "%T" mask outputs the 24-hour time as "HH:mm:ss".
I think this will make MySQL's slow_log table significantly more intuitive. And, it will make debugging slow-query-based incidents much easier to spot since the slow queries will now show up at the time in which they cause an impact as opposed to the time in which they finally return with a result.
Want to use code from this post? Check out the license.

Reader Comments