ColdFusion Threads Hanging On JDBC Pool CheckIn / CheckOut
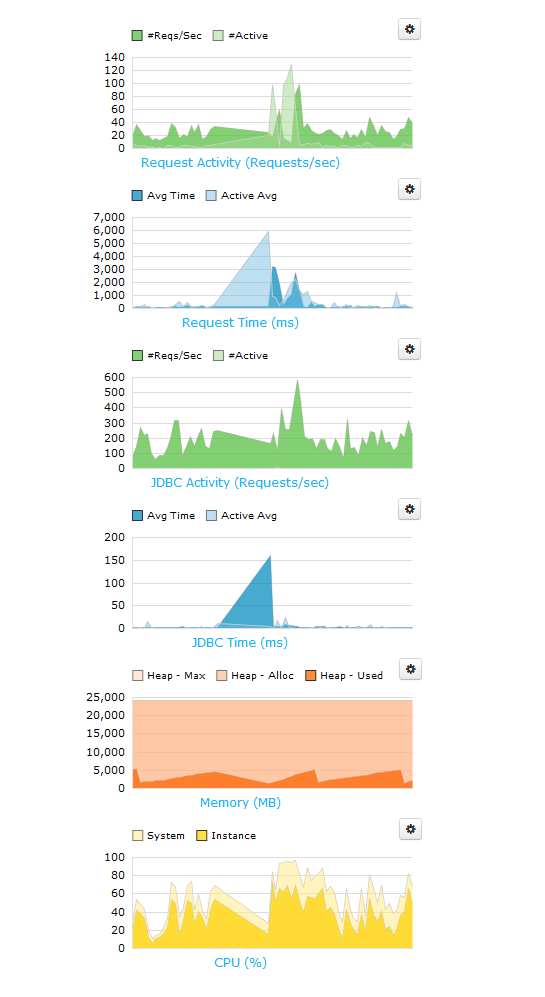
For months, Charlie Arehart, Mike Brunt, myself, and the awesome folks at EdgeWeb Hosting have been trying to track down an infuriating ColdFusion server issue. The issue was elusive and unpredictable. Sometimes it would happen in the middle of the night; sometimes it would happen in the middle of the day; sometimes it would happen every hour; sometimes it would go days without happening. But, when it did happen, the world would stop for a few seconds and our FusionReactor "web metrics" would look like this:
| |
|
|
||
| |
 |
|
||
| |
|
|
... and pretty much every stack trace in the subsequent FusionReactor Alert would be stuck in the JDBC pool, either trying to checkIn or checkOut a connection:
coldfusion.server.j2ee.sql.pool.JDBCPool.checkOut(JDBCPool.java:350)
coldfusion.server.j2ee.sql.pool.JDBCPool.requestConnection(JDBCPool.java:795)
coldfusion.server.j2ee.sql.pool.JDBCManager.requestConnection(JDBCManager.java:125)
coldfusion.server.j2ee.sql.JRunDataSource.getConnection(JRunDataSource.java:138)
coldfusion.sql.CFDataSource.getConnection(CFDataSource.java:42)
... or:
coldfusion.server.j2ee.pool.ObjectPool.checkIn(ObjectPool.java:263)
coldfusion.server.j2ee.sql.pool.JDBCPool.returnConnection(JDBCPool.java:821)
coldfusion.server.j2ee.sql.pool.JDBCPool.connectionClosed(JDBCPool.java:303)
coldfusion.server.j2ee.sql.JRunConnection.sendCloseEvent(JRunConnection.java:306)
coldfusion.server.j2ee.sql.JRunConnectionHandle.close(JRunConnectionHandle.java:56)
We tried everything! Upgrading the JVM. Downgrading the JVM. Patching ColdFusion. Checking all the network activity. Disabling services on the box(es). Tweaking the MySQL configuration. Tweaking the ColdFusion code. Swapping the ColdFusion licenses (Standard vs. Enterprise).
Nothing seemed to work!
Then, as the traffic on our servers increased, the issue appeared to become more predictable. I noticed that it seemed to be happening at the same minute of every hour. At the same time, Mike Brunt extracted some statistics from the server that showed that the JVM was running some automatic full Garbage Collection every hour. Could the two be related?
To test, I manually requested a Garbage Collection in the FusionReactor "web metrics" dashboard. And, lo and behold, I was able to trigger the same graphs and the same kind of FusionReactor alert (complete with JDBC-oriented stack traces)!
Mike then disabled the automatic, hourly Garbage Collection on all of our web nodes. And so far, we have not gotten a single FusionReactor alert! It looks like the full Garbage Collection was, indeed, the culprit... at least, as best as we can tell so far.
This has been driving me crazy for months! Hopefully, this will help someone else.

Reader Comments
For giggles, if you have a test environment, you could try out the ParNewGC, or the G1GC - there are several garbage collector algorithms you could try to see if one gets along better with your app than another.
http://blog.mgm-tp.com/2013/03/garbage-collection-tuning/
This article may have more details than you want, but:
TLDR; just try some different garbage collector settings and see how they do =)
@Justice,
I believe Charlie had suggested looking at some other algorithms; and probably we will at some point. It was just nice to have gotten to the bottom of it (or so I hope). We do have a testing environment; but, I wonder if we'll be able to test very well without the live traffic. I'll bring it up to the team, thanks!
We see similar spikes in request time as well and have not been able to tell what is causing them. How do you disable the automatic full garbage collection in the jvm?
@John,
Great question - I'll ping Mike see if he can drop a comment. He's the one that made the actual configuration change.
@Ben, thanks!
@John,
No problem. I pinged him - hopefully he'll drop a note.
@John the settings we evolved via many load tests and with several clients on 64-bit Java. These include changing the collector from the parallel connector to the concurrent mark sweep and disabling explicit GC's; here they are in full...
-XX:NewRatio=4 -XX:SurvivorRatio=8 -XX:+UseCompressedOops -Xss256k -XX:+UseConcMarkSweepGC -XX:+UseParNewGC -XX:+DisableExplicitGC -XX:+UseCMSInitiatingOccupancyOnly -XX:+CMSClassUnloadingEnabled -XX:+CMSScavengeBeforeRemark -XX:CMSInitiatingOccupancyFraction=68
The Xms and Xmx settings and to a lesser extent permanent generation settings depend on the amount of RAM you have.
There is more information here...http://www.cfwhisperer.com/post.cfm/coldfusion-10-enhanced-performance-settings (this shows CF10 but these setting work well for CF9.02 also.
@Mike,
Thanks! That stuff is Greek to me... for now! :)
@Mike and @Ben,
Thanks for sharing the info!
This couldn't have been more timely! Our graphs look exactly like this, and we have been pulling out all the stops trying to find a solution.
I had a suspicion that it had something to do with the garbage collection. I even switched to the the ParNewGC algorithm as @Justice mentioned as the description of ParNewGC sounded like it might cause the server to LOCK UP "less" during a collection, but didn't seem to make a difference. Must be the automatic full collections that are making the biggest difference.
Dased on the description of "New" and "Old" objects in this blog post (http://alagad.com/2008/01/11/the-heart-of-the-matter-the-jvm/) could the issue be that we have many objects that are being stored in the Application scope and therefore are causing a large amount of FULL GC?
Any thoughts on the JVM settings would be much appreciated. Should max and min be set close together, equal to each other, etc? I've heard arguments both ways so it's not constantly having to grow the heap, but if they are they same and you don't have the correct value that it can overrun the heap and get out of memory errors.
EG:
-XX:MaxPermSize
-Xmx
-Xmn
As I mentioned many of our objects are Gateway services objects that are stored in the APPLICATION scope of our apps. If that changes the recommendation of the JVM settings.
If you disable the automatic collection what is the recommended solution for doing collection manually and how often? Is this best suited to a scheduled task that runs during off peak hours?
Thanks!
Tim
^^^ Maybe Mike Brunt's comment already answered some of my questions since I last reloaded this page / submitted my previous comment. Thanks!
@Tim,
Hopefully Mike's comment helped. Unfortunately, the JVM is a mystery to me, mostly. I can tell you that since we've disabled the automatic, hourly GC, I haven't gotten a single FusionReactor alert. Granted, it's only been a few days, but this is a marked improvement over what we had before (it - alerts - were being triggered hourly).
Good luck!!
Thanks again for this post! Hopefully some of Mike's suggested settings will take away a lot pain and sleepless nights in trying to fix an app that seemingly works well then all of a sudden just hits the wall, then works great again. At least we hopefully will have a tangible explanation to give to our clients!
Here is another item worth doing, creating a GC log which will give you a lot of useful data. I show how to do that here http://www.cfwhisperer.com/post.cfm/10-steps-to-a-stable-and-performant-web-application-step-3
Also a great open source utility to view the logs is GCViewer...http://www.tagtraum.com/gcviewer.html
Nice work. I have also seen issue with checkin checkout when you use unique usernames for your db connections with maintain connections. CF will create a database connection pool for each user, as opposed to one database connection pool when you have your user\pwd stored in the CFadmin. As soon as we turned off maintain connections all was well. The overhead of hundreds of connection pools seemed to be the bottleneck. No noticeable performance loss was seen after turning off maintain connections.
@Mike Brunt - I can't thank you enough for your in depth blog posts on this subject. I have implemented GCViewer and made the other argument changes you posted above with a few changes, and so far our performance is appears to be much improved. We will have to watch it over the weekend when we see our spike in traffic to see what other changes we should make.
I found these posts in addition to Mike's links to be extremely helpful in explaining the purpose of the arguments he is suggesting to better understand why we should add them to our cf instance.
http://blog.griddynamics.com/2011/06/understanding-gc-pauses-in-jvm-hotspots_02.html
http://www.adobe.com/devnet/coldfusion/articles/coldfusion_performance.html
Since our application has a lot of New Generation object (local / variables scope variables) tweaking the NewRatio and the SurviorRatio seemed to be important in our case to get a performance boost.
This post ( http://www.curiousmentality.co.uk/2011/11/tuning-jvm-memory-settings/ ) has a little calculator that helped me understand how the allocated Heap Size was divided based on my chosen settings of NewRatio and SurviorRatio.
Thanks again for this. You always hear about how well CF can perform under load, but without this understanding of how to tune the JVM with the above suggested arguments it had seemed elusive.
Tim thank you for your comments and the links you placed there; they look very useful.
@Tim had asked above, "If you disable the automatic collection what is the recommended solution for doing collection manually and how often? Is this best suited to a scheduled task that runs during off peak hours?"
That points up something that I think was not quite clear from Ben's post: the JVM doesn't need any help in doing GCs. It will do them on its own when it needs to.
So in fact the jvm args that were there to do the hourly GC were added by someone. They are not there by default, and removing them helped solve this problem.
That's a primary answer for Tim (and others reading this): you don't need to do any jvm args or other efforts to force GCs. Leave that job to the JVM.
But it brings up a secondary issue: sadly, many people trade jvm args like baseball cards, and not all of them are as universally useful as some make them out to be.
So I'd propose one ought not implement a jvm arg change unless they're really confident it will help. And just because even an experienced person says to do it, be very careful about it, and consider removing it if things go amiss.
The challenge is that it may take hours, days, or weeks to notice a problem and connect that dot, as here. But I'm saying be suspicious of any non-standard jvm args. Make sure you really do understand their implications before using them, or be on guard for some time once you change one.
Even "long held knowledge" about some args changes as JVM released change. (Of course, that extends to those which Adobe prepopulates. A time may come when they are no longer appropriate.) I'm not saying any of this is easy to pin down. :-) But I stand by my assertion that it's better to be cautious about any jvm tweak.
But the main point again, Tim, is no, you don't need to help the JVM to do GCs. :-)
Hope that's helpful.
@Charlie, thanks Charlie and I fully agree; the settings we implemented at Invision were evolved over many hours of load-testing.
@Mike, just to help readers, are you saying that (that the settings were implemented after load testing) with respect to having turned on the GC interval settings?
If so, some may wonder then how they could have been the source of a problem. (I was never quite sure who had turned them on at Invision. If it was you, I wasn't meaning to impune you. My comment was directed to other readers and their own tuning efforts.)
But maybe you were saying that yes, you had enabled them based on such testing, and all had seemed well, but it was in the actual load in production where the problems arose, which were found to have those settings as their root cause. Is that it?
Just trying to help others to understand our discussion here. It was Tim's question about GCs (with this setting removed) that prompted me to write. I threw the other comment in more for the benefit of other readers on the broader topic of jvm tweaking attempts.
If nothing else, this would point out that not all load testing might really adequately simulate what happens in real prod loads, for whatever reason. So again, just all the more reason to be cautious (I think) about any jvm arg tweaks. I realize you may have a different take.
The good news is that that problem was indeed solved. :-) Glad to have helped where I could, and to get to work with you on it.
@Ben,@Mike Brunt
Mikes settings should drastically improve your JVM performance ... especially UseConcMarkSweepGC...
Be real
"Be real careful" when tweaking jvm args... small changes can make a big difference ...