
Reporting StatsD Metrics From The Browser In Angular 5.2.9
Last week, I discovered that you could listen for IMG error events using event delegation (so to speak) if you attach your event-handler to the Capture phase of the event life-cycle. As someone who works on a SaaS (Software as a Service) product that is based heavily on client-side image rendering, I'm enamored with the idea of being able to track whether or not images load for our users. But, such information is only helpful if it can be reported and aggregated for consumption by our engineers. Having worked heavily with StatsD and DogStatsD on the server-side, I wondered what it would look like to report StatsD metrics directly from the browser in an Angular 5.2.9 application.
Run this demo in my JavaScript Demos project on GitHub.
View this code in my JavaScript Demos project on GitHub.
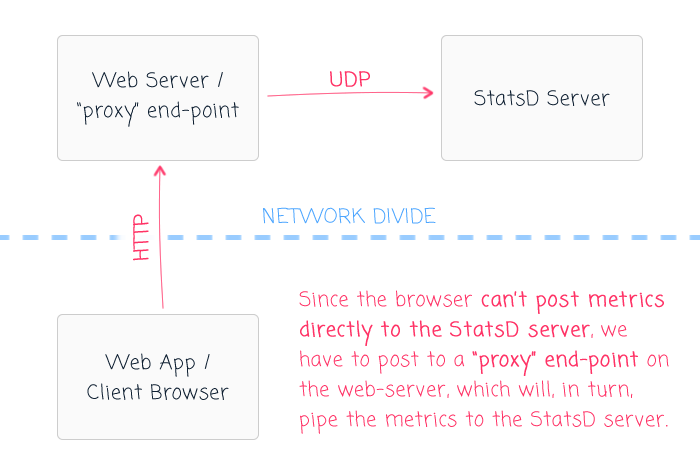
At first, sending StatsD metrics from the browser may seem like a trivial task. But, in reality, it's a very different problem with a lot of nuance. Server-side StatsD reporting is based on the User Datagram Protocol (UDP), which is a non-blocking, low-overhead way to send messages over a network connection. On the client-side (browser), we don't have UDP connections (at least, not that I know of); as such, StatsD metrics would likely need to be reported over Hypertext Transfer Protocol (HTTP). HTTP a much heavier, blocking way to send messages over a network connection.
If we're using HTTP, we have to be cognizant of the fact that browsers place limits on how many HTTP request can be made to a single domain in parallel. As such, "firing and forgetting" a large number of StatsD metrics may be cost-free on the server; but, on the client, it runs the very real risk of exhausting the HTTP connection pool upon which the rest of your web assets depend.
And, of course, while AJAX (Asynchronous JavaScript and JSON) represents the primary means for making client-side API calls, it is, by no means, the only way to send data from the browser to the server. We could use HTML IMG tags, where the IMG source implements the API GET request. We could use JSONP (JSON with Padding) to make API GET requests using HTML Script tags. We could use HTML Iframes to make API GET requests.
And, of course, we could use a non-HTTP alternative like a WebSocket to push messages to the server.
Each of these approaches has its own set of limitations. For example, if we use an IMG tag, JSONP, or an Iframe, we are limited to the HTTP GET method; which means there's no way to inject HTTP headers, such as those needed for Cross-Site Request Forgery (XSRF / CSRF) protection. Using an AJAX call may require special server-side headers, such as those for Cross-Origin Resource Sharing (CORS). And, needless to say, if we use something like a WebSocket, we would have to implement a WebSocket server on the other side of the network.
Like I said, sending StatsD metrics from the browser to the server is a multi-faceted, nuanced problem. And, for this particular exploration, I'm going to be sending those StatsD metrics using AJAX inside an Angular 5.2.9 application. But, the Angular portion is only the client-side part of the communication. On the server-side, we have to figure out how to accept those AJAX requests.
A traditional StatsD server only accepts UDP requests. So, we can't have the browser posting metrics directly to the StatsD server. Besides, doing so would likely fail a security audit. As such, one option - the option that I'm using - is to expose a "proxy" end-point in your application's existing API. This proxy end-point would accept the metrics, just like it would any other AJAX request. Then, it would turn around and pipe (in the non-technical sense) those metrics into the StatsD server using the traditional UDP workflow.
In my local development environment, I'm not creating this demo inside of an existing application. Instead, I'm just serving up my Angular assets using Apache. As such, I don't have an "existing API" to extend. Instead, I'm going to use Express.js to create a simple HTTP server with a single "proxy" end-point. And, since my Apache server is already using port 80, it means that my AJAX requests will cross ports (:80 to :8080). And, for this, Browser security requires CORS (Cross-Origin Resource Sharing) to be enabled.
Here is the simple Express.js application that I've put together for this demo:
// Require the core node modules.
var chalk = require( "chalk" );
var express = require( "express" );

// ----------------------------------------------------------------------------------- //
// ----------------------------------------------------------------------------------- //

var app = express();

// Enable middleware to automatically parse JSON request payloads.
app.use( express.json() );

// For the demo, since we're posting from port :80 to :8080, we need to enable CORS
// (Cross-Origin Resource Sharing). This is evaluated by the browser through the OPTIONS
// METHOD check. For simplicity, we're going to allow all (*) origins.
// --
// NOTE: In a "normal app", I probably wouldn't be posting to a different port. I'm only
// doing this because my port :80 is already in use on my local development environment.
app.use(
	function ( request, response, next ) {

		// Taken from: https://enable-cors.org/server_expressjs.html
		response.header( "Access-Control-Allow-Origin", "*" );
		response.header( "Access-Control-Allow-Headers", "Origin, X-Requested-With, Content-Type, Accept" );
		next();

	}
);

// This is our browser-sent StatsD metrics proxy route.
app.post(
	"/metrics-proxy",
	function ( request, response, next ) {

		console.log( chalk.red.bold( "Metrics sent from browser." ) );

		// This route-handler will send metrics to our Time-Series Database (TSDB). And,
		// as it will pass-through browser-provided (ie, USER-PROVIDED) values, we have
		// to take care to white-list the metrics that can be sent. Assume that if
		// something CAN be abused, someone will FIND A WAY to abuse it. If nothing else,
		// we don't want people filling our TSDB with garbage values.
		for ( var dataInput of request.body.dataInputs ) {

			switch ( dataInput.metric ) {
				case "angular-app.box.hide":
				case "angular-app.box.show":
				case "angular-app.interactions.first-click":
				case "angular-app.users":

					// At this point, we could use a normal StatsD client to forward this
					// metric onto the StatsD server. It should be noted, however, that I
					// am not performing any aggregation on the browser. As such, these
					// metrics values will be slightly delayed and show up as "clumps" in
					// the TSDB.
					// --
					// NOTE: For the demo, I'm just simulating a simple UDP string.
					console.log(
						chalk.green( ` ➜ ${ chalk.bold( "Sending:" ) }` ),
						chalk.green( formatDataInput( dataInput ) )
					);

				break;
				default:

					console.log(
						chalk.dim.italic( " > Suspicious input skipped:" ),
						chalk.dim.italic( dataInput.metric )
					);

				break;
			}

		}

		response.status( 200 );
		response.json( true );

	}
);

// ----------------------------------------------------------------------------------- //
// ----------------------------------------------------------------------------------- //

// I format the data-input for the demo output. This is intended to mimic the formatting
// used by a real StatsD / DogStatsD client.
function formatDataInput( dataInput ) {

	switch ( dataInput.type ) {
		case "counter":
			var indicator = "c";
		break;
		case "gauge":
			var indicator = "g";
		break;
		case "histogram":
			var indicator = "h";
		break;
		case "set":
			var indicator = "s";
		break;
		case "timing":
			var indicator = "ms";
		break;
	}

	var tags = ( dataInput.tags && dataInput.tags.length )
		? `|#${ dataInput.tags.join( "," ) }`
		: ""
	;

	return( `${ dataInput.metric }:${ dataInput.value }|${ indicator }${ tags }` );

}

// ----------------------------------------------------------------------------------- //
// ----------------------------------------------------------------------------------- //

// Start the HTTP server.
app.listen(
	8080,
	function handleListen() {

		console.log( "Node.js demo server listening on port :8080" );

	}
);
As you can see, this Express.js server exposes a single end-point, "/metrics-proxy". This end-point accepts a POST request with a JSON body. This JSON body is parsed and piped into the StatsD server. Of course, since I don't actually have a working StatsD server, I'm representing an implied StatsD server as console.log() output. In this way, I'm attempting to illustrate the translation of an HTTP request into a UDP request.
An equally importantly aspect of this proxy is the fact that I am making some attempt to "whitelist" the metrics that this end-point will accept. Since the metric data is, for all intents and purposes, user-provided, it means that we can't trust it without verifying it. And, we have to assume that anything that can be abused by a malicious user will be abused at some point.
NOTE: In this particular demo, I'm not whitelisting the "tags" collection. But, presumably, the tags would need a similar treatment. Especially since a large number of malicious tags could actually hurt the performance of your Time-Series Database (TSDB) dashboards. Trust me, I know from experience.
Of course, the amount of validation that your application performs needs to be commensurate with the potential damage that such abuse may entail. Your mileage may vary. No need to bend over backwards if the risk isn't all that impactful. That said, if you pay for the number of metrics that your TSDB stores, an attack on such an end-point could have a real dollars-and-cents impact on your bottom-line.
Now that we have the server-side proxy working, let's take a look at the Angular side of the network. Going back to my earlier statement about this being a multi-faceted problem, I didn't want to paint myself - or the other engineers on my team - into a corner. Out of the box, I wanted it to be super easy to send StatsD metrics from the browser based on some good assumptions; but, I didn't want to assume that only one implementation was possible.
To create a few degrees of freedom around how the StatsD metrics get recorded and reported, I tried to tease apart the various areas of concern for my metrics module. What I came up with was a layered approach:
- API / service layer.
- Gateway / persistence abstraction.
- Transport / network abstraction.
The API / service layer is the portion of the module that is exposed to the rest of the Angular app in the form of an injectable service. This service has public methods that should look familiar to anyone that's used StatsD or DataDog's DogStatsD before:
- gauge() : void
- histogram() : void
- increment() : void
- set() : void
- timing() : void
The API / service layer depends on the Gateway layer, which is a polymorphic service that exposes a single method:
- send( dataInput: DataInput ) : void
By default, the metrics module will use a buffering Gateway implementation that will store metrics in-memory for a configurable amount of time before flushing them to the Transport layer. The Transport layer is, itself, a polymorphic service that exposes a single method:
- send( dataInputs: DataInput[] ) : Promise<void>
By default, the metrics module will use an HTTP Transport implementation that posts metrics to a configurable end-point using Angular's HttpClient instance.
Let's explore this code from the top-down. First, let's take a look at the app-component - the only component in this demo - that records some trivial metrics about the user's interaction with the page:
// Import the core angular services.
import { Component } from "@angular/core";
// Import the application components and services.
import { MetricsService } from "./metrics/metrics.module";
// ----------------------------------------------------------------------------------- //
// ----------------------------------------------------------------------------------- //
@Component({
selector: "my-app",
styleUrls: [ "./app.component.less" ],
template:
`
<p>
<a (click)="showBox()">Show Box</a> |
<a (click)="hideBox()">Hide Box</a>
</p>
<div *ngIf="isShowingbox" class="box">
Metrics will be recorded as this box is toggled.
</div>
`
})
export class AppComponent {
public isShowingbox: boolean;
private loadedAt: number;
private firstClickAt: number | null;
private metrics: MetricsService;
// I initialize the app component.
constructor( metrics: MetricsService ) {
this.metrics = metrics;
this.firstClickAt = null;
this.isShowingbox = false;
this.loadedAt = Date.now();
// Record this user as a unique value in the "set" of users that have loaded the
// application in this stats-collection window (4 = fake user ID).
this.metrics.set({
metric: "users",
value: 4,
tags: [ "app-load" ]
});
}
// ---
// PUBLIC METHODS.
// ---
// I hide the demo box.
public hideBox() : void {
// If the box is actually transitioning to being hidden, record the click.
if ( this.isShowingbox ) {
this.metrics.increment( "box.hide" );
}
this.isShowingbox = false;
}
// I show the demo box.
public showBox() : void {
// If the box is actually transitioning to being visible, record the click.
if ( ! this.isShowingbox ) {
this.metrics.increment( "box.show", 1 );
}
// If this is the first user-interaction, log it and record it.
if ( ! this.firstClickAt ) {
this.firstClickAt = ( Date.now() - this.loadedAt );
this.metrics.timing( "interactions.first-click", this.firstClickAt );
}
this.isShowingbox = true;
}
}
As you can see, the app component is receiving a dependency of type MetricsService. This is the API / service layer provided by our metrics module which exposes StatsD-inspired methods. And, just as with a server-side StatsD service, the app component it consuming the MetricsService in a "fire and forget" approach. It doesn't care about any errors (knowing that none will bubble-up). And, it doesn't care about HTTP requests or connection pooling or anything relating to what actually happens below the surface of each API method call.
In fact, the app component doesn't care about the MetricsService implementation at all. Which means that I can swap the lower-level implementation details in and out using different bootstrapping configurations. For example, when I run this page in my local development environment and click around, I get the following output:
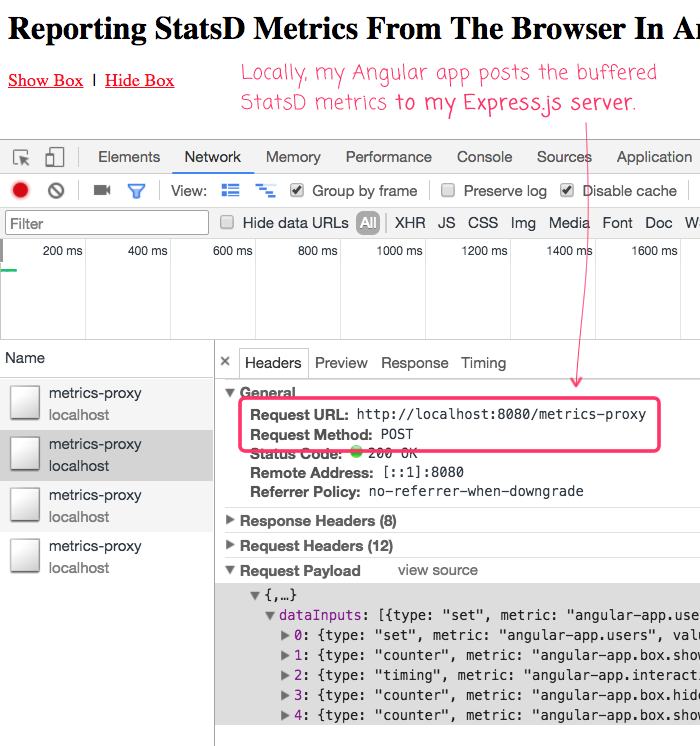
As you can see, the various metrics were buffered in-memory and then pushed to my Express.js proxy server using an AJAX request.
When this demo is running on GitHub Pages, however, there is no Express.js server. There is no "/metrics-proxy" end-point. As such, I need to swap out the HttpTransport implementation with the ConsoleTransport implementation. Which means that when I open the GitHub-based example and click around, I get the following output:
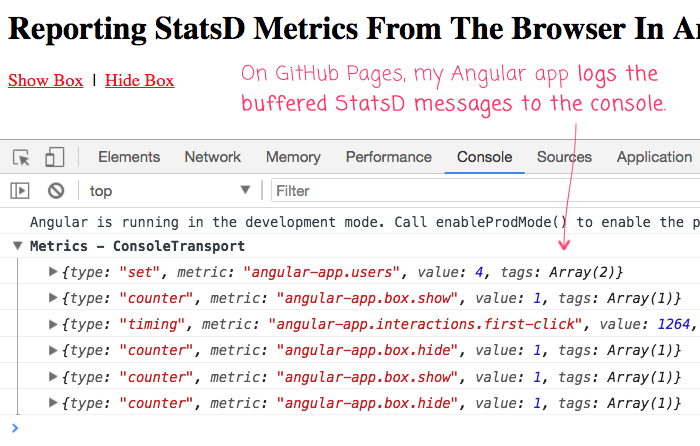
As you can see, when running on GitHub pages, there is no HTTP network request. The metrics are still get buffered in-memory (thanks to the same MetricsGateway implementation); but, instead of being flushed to the network, they are being flushed to the browser console.
To understand this runtime behavior swapping, let's step up in the application module, which is where we import and configure out MetricsModule:
// Import the core angular services.
import { BrowserModule } from "@angular/platform-browser";
import { NgModule } from "@angular/core";

// Import the application components and services.
import { AppComponent } from "./app.component";
import { ConsoleTransport } from "./metrics/metrics.module";
import { HttpTransport } from "./metrics/metrics.module";
import { MetricsGateway } from "./metrics/metrics.module";
import { MetricsModule } from "./metrics/metrics.module";
import { MetricsTransport } from "./metrics/metrics.module";
import { RealtimeGateway } from "./metrics/metrics.module";

// ----------------------------------------------------------------------------------- //
// ----------------------------------------------------------------------------------- //

@NgModule({
	bootstrap: [
		AppComponent
	],
	imports: [
		BrowserModule,
		// By default, the Metrics module uses the BufferedGateway and the HttpTransport.
		// However, I'm overriding it below (in the Providers) since I'll have a server
		// locally, but not when this demo is on GitHub.
		MetricsModule.forRoot({
			url: "http://localhost:8080/metrics-proxy",
			bufferDuration: ( 5 * 1000 ),
			prefix: "angular-app.",
			tags: [ "angular5" ]
		})
	],
	declarations: [
		AppComponent
	],
	providers: [
		{
			provide: MetricsTransport,
			// When this demo is hosted on GitHub pages, I'm going to use the
			// ConsoleTransport, since I have no server. But, locally, I can use the
			// Node.js server in the ./api directory.
			useClass: window.location.host.includes( "github" )
				? ConsoleTransport
				: HttpTransport
		},
		// {
		// provide: MetricsGateway,
		// useClass: RealtimeGateway
		// }
	]
})
export class AppModule {
	// ...
}
As you can see, I'm importing the MetricsModule using the .forRoot() pattern which allows me to provide some basic configuration for the metrics behavior (such as the HTTP end-point for the default persistence). And, if I only did that, our metrics runtime implementation would use the default BufferedGateway and HttpTransport class. But, after I import the MetricsModule module, I go one step further and define an explicit implementation for the MetricsTransport dependency-injection token. I do so by looking at the browser's host; and, if it's GitHub - where I don't have an Express.js server running - I use the ConsoleTransport. Otherwise, I use the default HttpTransport.
Let's jump over into the MetricsModule so we can see how the various metrics services are being exposed:
// Import the core angular services.
import { HttpClientModule } from "@angular/common/http";
import { ModuleWithProviders } from "@angular/core";
import { NgModule } from "@angular/core";
import { Provider } from "@angular/core";

// Import the module services.
import { BUFFERED_GATEWAY_DURATION } from "./metrics.gateway";
import { BufferedGateway } from "./metrics.gateway";
import { MetricsGateway } from "./metrics.gateway";
import { RealtimeGateway } from "./metrics.gateway";

import { METRICS_PREFIX } from "./metrics.service";
import { METRICS_TAGS } from "./metrics.service";
import { MetricsService } from "./metrics.service";

import { ConsoleTransport } from "./metrics.transport";
import { HTTP_TRANSPORT_URL } from "./metrics.transport";
import { HttpTransport } from "./metrics.transport";
import { MetricsTransport } from "./metrics.transport";

// ----------------------------------------------------------------------------------- //
// ----------------------------------------------------------------------------------- //

// Export the services that the parent application may need for dependency-injection,
// including the ability to implement custom services based on our abstractions.
export { ConsoleTransport };
export { HttpTransport };
export { MetricsGateway };
export { MetricsService };
export { MetricsTransport };
export { RealtimeGateway };

interface ModuleOptions {
	bufferDuration?: number;
	prefix?: string;
	tags?: string[];
	url?: string;
}

@NgModule({
	imports: [
		HttpClientModule
	]
})
export class MetricsModule {

	static forRoot( options?: ModuleOptions ) : ModuleWithProviders {

		return({
			ngModule: MetricsModule,
			providers: [
				MetricsService,
				{
					// The default gateway will use buffering.
					provide: MetricsGateway,
					useClass: BufferedGateway
				},
				{
					// The default transport will use HTTP.
					provide: MetricsTransport,
					useClass: HttpTransport
				},
				{
					provide: METRICS_PREFIX,
					useValue: ( ( options && options.prefix ) || "" )
				},
				{
					provide: METRICS_TAGS,
					useValue: ( ( options && options.tags ) || [] )
				},
				{
					provide: HTTP_TRANSPORT_URL,
					useValue: ( ( options && options.url ) || "/" )
				},
				{
					provide: BUFFERED_GATEWAY_DURATION,
					useValue: ( ( options && options.bufferDuration ) || 5000 )
				},
			]
		});

	}

}
As you can see, the .forRoot() pattern is used to configure the value of a few dependency-injection tokens. For the most part, these DI tokens are there to power the default services that the MetricsModule provides. The more interesting services provided by the module are:
- MetricsService
- MetricsGateway
- MetricsTransport
The MetricsService is a concrete class that exposes the metrics-collection API (like .increment()). But, the other two services are actually abstract classes that are being used as both dependency-injection tokens and as class interfaces. Each of these classes can be overridden by the parent application as needed. For example, if you wanted to use the default BufferingGateway, but switch over to using JSONP instead of AJAX, you could create an implementation for the MetricsTransport interface. Or, if you wanted to switch to realtime recordings over a WebSocket connection, you could create an implementation for the MetricsGatway interface. In this way, the module is ready-to-consume right out of the box via the commonly-used HTTP workflow; but, it's flexible enough so that you can replace most parts of it.
Let's take a look at the MetricsService class. As I said before, this is a concrete class. There is no abstraction because it is not a class that is intended to be overridden.
// Import the core angular services.
import { Inject } from "@angular/core";
import { Injectable } from "@angular/core";
import { InjectionToken } from "@angular/core";

// Import the application components and services.
import { MetricsGateway } from "./metrics.gateway";

// ----------------------------------------------------------------------------------- //
// ----------------------------------------------------------------------------------- //

export var METRICS_PREFIX = new InjectionToken<string>( "Prefix added to all metrics." );
export var METRICS_TAGS = new InjectionToken<string[]>( "Tags added to all metrics." );

interface BaseOptions {
	metric: string;
	tags?: string[];
}

interface GaugeOptions extends BaseOptions {
	value: number | string;
}

interface HistogramOptions extends BaseOptions {
	value: number;
}

interface IncrementOptions extends BaseOptions {
	value: number;
}

interface SetOptions extends BaseOptions {
	value: number | string;
}

interface TimingOptions extends BaseOptions {
	value: number;
}

@Injectable()
export class MetricsService {

	private metricsGateway: MetricsGateway;
	private prefix: string;
	private tags: string[];

	// I initialize the metrics service.
	constructor(
		metricsGateway: MetricsGateway,
		@Inject( METRICS_PREFIX ) prefix: string,
		@Inject( METRICS_TAGS ) tags: string[]
		) {

		this.metricsGateway = metricsGateway;
		this.prefix = prefix;
		this.tags = tags;

	}

	// ---
	// PUBLIC METHODS.
	// ---

	// I record the gauge metric.
	// --
	// NOTE: The value here is a number | string because it can accept relative values
	// such as "+4" and "-2" in addition to the absolute numeric values.
	public gauge( options: GaugeOptions ) : void;
	public gauge( metric: string, value: number | string ) : void;
	public gauge( a: any, b?: any ) : void {

		if ( typeof( a ) === "string" ) {

			this.metricsGateway.send({
				type: "gauge",
				metric: this.expandMetric( a ),
				value: b,
				tags: this.tags
			});

		} else {

			this.metricsGateway.send({
				type: "gauge",
				metric: this.expandMetric( a.metric ),
				value: a.value,
				tags: this.tags.concat( a.tags || [] )
			});

		}

	}


	// I record the histogram metric.
	public histogram( options: HistogramOptions ) : void;
	public histogram( metric: string, value: number ) : void;
	public histogram( a: any, b?: any ) : void {

		if ( typeof( a ) === "string" ) {

			this.metricsGateway.send({
				type: "histogram",
				metric: this.expandMetric( a ),
				value: b,
				tags: this.tags
			});

		} else {

			this.metricsGateway.send({
				type: "histogram",
				metric: this.expandMetric( a.metric ),
				value: a.value,
				tags: this.tags.concat( a.tags || [] )
			});

		}

	}


	// I record the increment metric.
	public increment( options: IncrementOptions ) : void;
	public increment( metric: string, value: number ) : void;
	public increment( metric: string ) : void;
	public increment( a: any, b?: any ) : void {

		if ( typeof( a ) === "string" ) {

			this.metricsGateway.send({
				type: "counter",
				metric: this.expandMetric( a ),
				value: ( b || 1 ),
				tags: this.tags
			});

		} else {

			this.metricsGateway.send({
				type: "counter",
				metric: this.expandMetric( a.metric ),
				value: a.value,
				tags: this.tags.concat( a.tags || [] )
			});

		}

	}


	// I record the set metric.
	public set( options: SetOptions ) : void;
	public set( metric: string, value: number | string ) : void;
	public set( a: any, b?: any ) : void {

		if ( typeof( a ) === "string" ) {

			this.metricsGateway.send({
				type: "set",
				metric: this.expandMetric( a ),
				value: b,
				tags: this.tags
			});

		} else {

			this.metricsGateway.send({
				type: "set",
				metric: this.expandMetric( a.metric ),
				value: a.value,
				tags: this.tags.concat( a.tags || [] )
			});

		}

	}


	// I record the timing metric.
	public timing( options: TimingOptions ) : void;
	public timing( metric: string, value: number ) : void;
	public timing( a: any, b?: any ) : void {

		if ( typeof( a ) === "string" ) {

			this.metricsGateway.send({
				type: "timing",
				metric: this.expandMetric( a ),
				value: b,
				tags: this.tags
			});

		} else {

			this.metricsGateway.send({
				type: "timing",
				metric: this.expandMetric( a.metric ),
				value: a.value,
				tags: this.tags.concat( a.tags || [] )
			});

		}

	}

	// ---
	// PRIVATE METHODS.
	// ---

	// I convert the given metric suffix to the full metric key.
	private expandMetric( metric: string ) : string {

		return( this.prefix + metric );

	}

}
As you can see, nothing particularly interesting going on here - just the common StatsD metrics methods. Since I am using TypeScript in Angular, I am defining several methods signatures such that each method can be invoked using simple arguments; or, an options hash.
Really, the only important thing to see here is that this MetricsService is receiving a dependency of type MetricsGateway. Remember, MetricsGateway is actually an abstract class that is acting as both a dependency-injection token and a class interface. As such, the MetricsService doesn't need to know what the MetricsGateway is going - it only needs to know that the MetricsGateway if exposing a method named, send(). Essentially, the MetricsService depends on an interface; but, not on any particular MetricsGateway implementation.
The MetricsGateway file then defines both the abstract class and the default BufferingGateway implementation:
// Import the core angular services.
import { ErrorHandler } from "@angular/core";
import { HttpClient } from "@angular/common/http";
import { Inject } from "@angular/core";
import { Injectable } from "@angular/core";
import { InjectionToken } from "@angular/core";

// Import the module services.
import { MetricsTransport } from "./metrics.transport";

// ----------------------------------------------------------------------------------- //
// ----------------------------------------------------------------------------------- //

export interface DataInput {
	[key: string]: any;
}

// I provide the interface and dependency-injection token for the metrics gateway. If
// you want to provide a custom implementation, just implement this interface.
export abstract class MetricsGateway {
	abstract send( dataInput: DataInput ) : void;
}

// ----------------------------------------------------------------------------------- //
// ----------------------------------------------------------------------------------- //

// CAUTION: Because this gateway implementation buffers metrics (to reduce the number of
// HTTP requests), it is sort of acting as both a StatsD client and a StatsD server.
// However, it is not "aggregating" stats the way a normal StatsD server would. As such,
// these metrics will be somewhat "oddly chunked" in your Time-Series Database when they
// are eventually recorded by the sever-side API.

export var BUFFERED_GATEWAY_DURATION = new InjectionToken<number>( "Time (ms) that metrics will be buffered before getting flushed." );

@Injectable()
export class BufferedGateway implements MetricsGateway {

	private buffer: any[];
	private bufferDuration: number;
	private bufferTimer: number;
	private errorHandler: ErrorHandler;
	private isSendingDataInputs: boolean;
	private transport: MetricsTransport;

	// I initialize the metrics gateway.
	constructor(
		@Inject( BUFFERED_GATEWAY_DURATION ) bufferDuration: number,
		errorHandler: ErrorHandler,
		transport: MetricsTransport
		) {

		this.errorHandler = errorHandler;
		this.transport = transport;

		this.buffer = [];
		this.bufferDuration = bufferDuration;
		this.bufferTimer = null;
		this.isSendingDataInputs = false;

	}

	// ---
	// PUBLIC METHODS.
	// ---

	// I send the given data-input to the back-end persistence.
	public send( dataInput: DataInput ) : void {

		this.buffer.push( dataInput );
		this.prepareToSendDataInputs();

	}

	// ---
	// PRIVATE METHODS.
	// ---

	private prepareToSendDataInputs() : void {

		if (
			// If there's no data buffered, there's nothing to send to the server.
			! this.buffer.length ||
			// If a timer has been created, the buffered data inputs are already
			// scheduled for departure.
			this.bufferTimer ||
			// If we are currently sending data inputs to the server, let the buffered
			// data remain in the buffer until the current request has completed.
			this.isSendingDataInputs
			) {

			return;

		}

		// Start the metrics buffering window.
		this.bufferTimer = setTimeout(
			() => {

				var dataInputs = this.buffer;
				this.buffer = [];
				this.bufferTimer = null;
				this.isSendingDataInputs = true;

				this.sendDataInputs( dataInputs ).then(
					() => {

						// Since we want to serialize metrics requests (so as not to
						// saturate the browser's HTTP connection pool), let's check to
						// see if we need to re-initiate the buffer-timer to flush any
						// metrics that have been buffered during this request.
						this.isSendingDataInputs = false;
						this.prepareToSendDataInputs();

					}
				);

			},
			this.bufferDuration
		);

	}


	// I perform the actual request using the underlying transport. This is a safe method
	// to call -- all errors will be swallowed.
	private async sendDataInputs( dataInputs: DataInput[] ) : Promise<void> {

		try {

			await this.transport.send( dataInputs );

		} catch ( error ) {

			this.errorHandler.handleError( error );

		}

	}

}

// ----------------------------------------------------------------------------------- //
// ----------------------------------------------------------------------------------- //

@Injectable()
export class RealtimeGateway implements MetricsGateway {

	private errorHandler: ErrorHandler;
	private transport: MetricsTransport;

	// I initialize the metrics gateway.
	constructor(
		errorHandler: ErrorHandler,
		transport: MetricsTransport
		) {

		this.errorHandler = errorHandler;
		this.transport = transport;

	}

	// ---
	// PUBLIC METHODS.
	// ---

	// I send the given data-input to the back-end persistence.
	public send( dataInput: DataInput ) : void {

		this.transport
			.send( [ dataInput ] )
			.catch(
				( error ) => {

					this.errorHandler.handleError( error );

				}
			)
		;

	}

}
Here, we see the same pattern that we saw in the previous class - the BufferingGateway receives an implementation of the MetricsTransport interface; but, the gateway doesn't have to know anything about the implementation details. It only has to know that the given transport exposes a method names, .send().
One thing of note that can't easily be captured in the various interface definitions is the fact that the Gateway is intended to be "safe". Meaning, its .send() method will never throw an error. If you look at the async details, you'll see that the gateway implementations are swallowing errors and piping them to Angular's ErrorHandler implementation. Just as with the server-side workflows, I'm intending the metrics module to be used in a "fire and forget" manner, which means not having to be afraid of errors bubbling up.
ASIDE: You might wonder why I made the gateway the "safe" aspect and not the service? Meaning, why not put the try/catch logic in the service and let all of the lower-level implementations throw errors? The decision was somewhat arbitrary. But, there's nothing that can really error in the service-layer. And, there's no guarantee that a "transport" will actually come into play (in the case of a custom Gateway). As such, the Gateway felt like the point at which the safety guarantee made sense. But, I don't feel that strongly about the decision.
The final layer below the Gateway is the Transport. In the metrics module, the Tranport file defines how the collected metrics actually get to their final storage:
// Import the core angular services.
import { HttpClient } from "@angular/common/http";
import { Inject } from "@angular/core";
import { Injectable } from "@angular/core";
import { InjectionToken } from "@angular/core";

// ----------------------------------------------------------------------------------- //
// ----------------------------------------------------------------------------------- //

export interface DataInput {
	[key: string]: any;
}

// I provide the interface and dependency-injection token for the metrics transport. If
// you want to provide a custom implementation, just implement this interface.
export abstract class MetricsTransport {
	abstract send( dataInputs: DataInput[] ) : Promise<void>;
}

// ----------------------------------------------------------------------------------- //
// ----------------------------------------------------------------------------------- //

export var HTTP_TRANSPORT_URL = new InjectionToken<string>( "Full URL for HTTP transport." );

@Injectable()
export class HttpTransport implements MetricsTransport {

	private httpClient: HttpClient;
	private url: string;

	// I initialize the http transport behavior.
	constructor(
		httpClient: HttpClient,
		@Inject( HTTP_TRANSPORT_URL ) url: string
		) {

		this.httpClient = httpClient;
		this.url = url;

	}

	// ---
	// PUBLIC METHODS.
	// ---

	// I send the given data-inputs to the persistence layer.
	public async send( dataInputs: DataInput[] ) : Promise<void> {

		var response = await this.httpClient
			.post(
				this.url,
				{
					dataInputs: dataInputs
				},
				{
					headers: {
						"Content-Type": "application/json; charset=UTF-8"
					}
				}
			)
			.toPromise()
		;

	}

}

// ----------------------------------------------------------------------------------- //
// ----------------------------------------------------------------------------------- //

export class ConsoleTransport implements MetricsTransport {

	// I send the given data-inputs to the persistence layer.
	public async send( dataInputs: DataInput[] ) : Promise<void> {

		console.group( "Metrics - ConsoleTransport" );
		for ( var dataInput of dataInputs ) {

			console.log( dataInput );

		}
		console.groupEnd();

	}

}
Here's where you can finally see the difference in the Transport implementation that I use in the various environments (local development and GitHub Pages). The wonderful thing about abstractions and coding to interfaces is that I can swap this one portion in-and-out while leaving everything else the same.
This was a really fun experiment. It took me a while to find the seams / separation of responsibilities within the metrics module. But, once I started to tease them out, everything else kind of fell into place.
Want to use code from this post? Check out the license.

Reader Comments
Re: "abstract classes that are being used as both dependency-injection tokens and as class interfaces" ~ That's formally called, "Polymorhpic Parameters" ~ https://en.wikipedia.org/wiki/Parametric_polymorphism
@Edward,
Ahhh, good to know. I just assume that half of the OO-related terminology I use is inaccurate. Good to know what this stuff really is :)
Hello! Chrome can use HTTP3 if it's started with flags. HTTP3 is UDP based, instead of TCP. https://blog.cloudflare.com/http3-the-past-present-and-future/#how-did-we-get-here
Would this work natively with statsd?
@David,
I am not entirely sure what you are asking. Since the browser isn't actually communicating directly with the StatsD data-store - it's making an AJAX call to the server as a proxy - it should be able to use whatever technologies allows the client-server communication. I don't know much about HTTP2 and I've never even heard of HTTP3 :D So, I can't really comment.
If you're asking whether or not the browser can use HTTP3 to make a UDP call directly to a StatsD server, I have no idea. I assume that would be possible if you're telling me that the HTTP3 supports UDP. However, you may not want to just expose your StatsD server to the public -- that could be a security concern.
Thanks Ben
The statsd server will be private, in a back office function. HTTP3 uses UDP in place of TCP, so i'm proposing going from the browser directly to the statsd server. I was wondering if you know of any reason this wouldn't work.
@David,
Having never played with HTTP2 or HTTP3, I would assume that the only issue would be having an AJAX client that understands how to make the request. I am not sure if the UDP aspect is exposed to the browser API; or, if that's an implementation detail under the hood.
It sounds intriguing, though! Probably worth trying out.