
A Graph Should Answer One Question And Should Answer It Well
For years, Uncle Bob Martin has been telling the software development community that Functions should do one thing; and, should do it well. To me, this advice is about focus and cohesion. I really like this mentality and I believe that it applies to much more than just programming. But, as of late, I've been thinking about this advice in terms of logging metrics. Or, more specifically, in terms of graphing metrics. The more I noodle on this, the more I believe that a graph should answer one question; and, should answer it well.
To be honest, it's not always easy to understand what question is being answered by a graph. Generally speaking, graphs are about system health. So, it's easy to fall into the trap of thinking that a graph is answering the question, "Is the system healthy?". But, this question is too broad and provides far too much wiggle room. After all, I could include every recorded metric in the same graph and claim that it offers an at-a-glance view of the system health.
Clearly, that would be insane and unusable. But, it demonstrates the slippery slope of broad questions. To help narrow in on the right question, perhaps we can leverage one of the red flags that we use in software development: the word "And". If a graph is answer this question AND that question, the graph is doing too much.
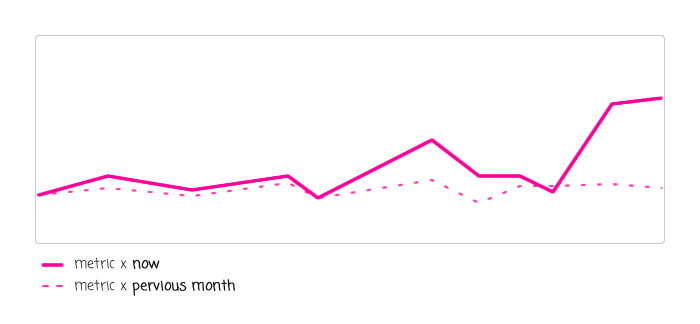
For example, imagine this graph:
What is the 95th-percentile response time for these end-points AND how does that compare to the previous month?
Such a graph might look like this:
| |
|
|
||
| |
 |
|
||
| |
|
|
It's a relatively simple graph, but the use of "AND" in the question indicates that this graph is likely trying to do too much. I think it would be better for the graph to answer either one of those questions, but not both. For example, we could create a graph that answers only the one question:
How does the 95th-percentile response time for these end-points compare to the prior month?
Such a graph might look like this:
| |
|
|
||
| |
|
|
||
| |
|
|
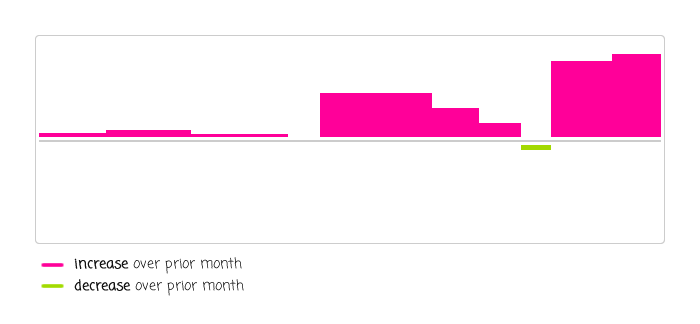
Obviously, this is the same exact graph; but, by changing the scope of the question - focusing purely on the month-over-month delta - we can change the format of the graph and not lose any information. For example, the same graph could be rendered like this:
| |
|
|
||
| |
 |
|
||
| |
|
|
In this version, we can't see what the 95th-percentile is (in terms of absolute values); but, we can clearly see that it is increasing over time. And, that there is clearly a tipping point in that behavior. In fact, I would argue that this latter graph actually does a better job of answering the question since it removes the noise of the two graphs and consolidates them both down into one meaningful, easy-to-understand metric.
The logging and monitoring of a system's behavior is ultimately about taking action. Do I need to do something immediately in order to alleviate a problem? Do we need to roll-back a deployment that caused a sudden performance decrease? How much longer can this rate of increase be sustained before we need to refactor the application? Can this feature be end-of-lifed due to lack of interest? These are specific questions and they should be answered by graphs that do one thing; and, do it well.

Reader Comments