Adding DataDog / DogStatsD Support To My StatsDGateway ColdFusion Component
Two years ago, I published StatsDGateway - a StatsD library for ColdFusion. This is a flexible StatsD library that supported UDF (User Datagram Protocol) transports, in-memory transports, buffered transports, and whatever kind of custom transport you might need to create (such as a Standard Output transport). And, in two years, it's been running great. Recently, however, I wanted to learn more about DataDog's tagging extensions for StatsD. So, for the first time in two years, I've released an update for StatsDGateway, adding basic support for DataDog's DogStatsD extensions to the StatsD protocol.
View the StatsDGatway.cfc project on my GitHub account.
The basic StatsD datagram format looks like this:
metric.name:value|type|@sample_rate
DataDog's StatsD platform will gladly consume these backward-compatible formats. However, it also accepts a tagging extension that adds a segment to the end of the datagram string:
metric.name:value|type|@sample_rate|#tag1:value,tag2
This new "tags" segment is a comma-delimited list of tags that can be either stand-alone booleans or "key:value" pairs. Tags are a way to add dimensions to mentrics so that they can be isolated, aggregated, and compared in your DataDogHQ dashboards.
From the DataDog Documentation: We store one time series per host + metric + tag combination on our backend, thus we cannot support infinitely bounded tags. Please don't include endlessly growing tags in your metrics, like timestamps or user ids. Please limit each metric to 1000 tags.
I'm still trying to wrap my head around the true power of DataDog's tagging extension for StatsD; but, I suspect that it will completely change the way that I think about instrumenting my applications. For example, instead of creating an individual StatsD metric for each route in my blog, I can create a single request metric and then provide the route as a tag on that metric. For example:
bennadel.request:1|c|#route:home
bennadel.request:1|c|#route:blog.list
bennadel.request:1|c|#route:blog.view
bennadel.request:1|c|#route:about
bennadel.request:1|c|#route:photos
bennadel.request:1|c|#route:photos.view
bennadel.request:1|c|#route:contact
bennadel.request:1|c|#route:askben
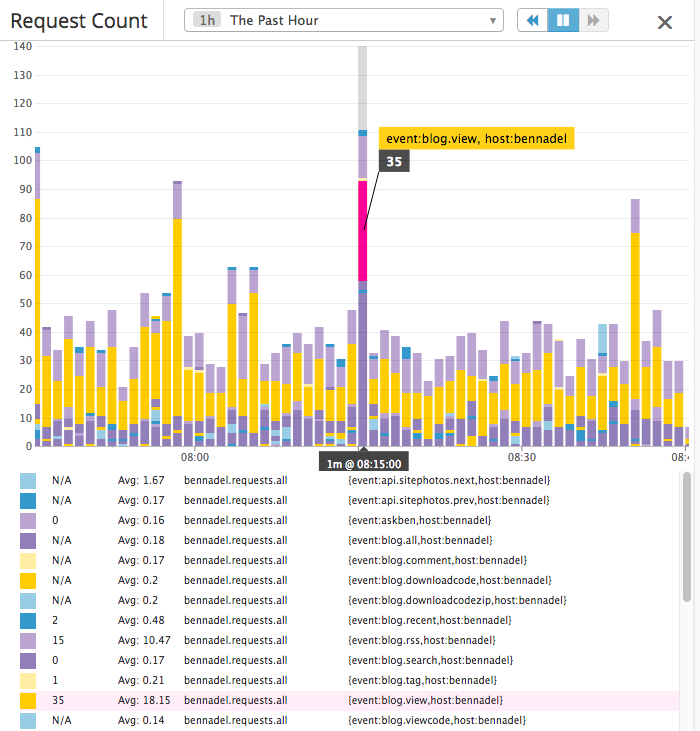
Notice that I'm only defining one count metric name, "bennadel.request"; but, I'm providing a tag - "route" - which annotates the metric with the type of request being made by the user. Once this tagged metric starts flowing into DataDogHQ, I can then see a complete breakdown of the traffic coming into my site:
NOTE: I'm using slightly different naming in my actual code, so the following screenshot doesn't exactly line up with the previous explanation.
| |
|
|
||
| |
 |
|
||
| |
|
|
As you can see, this one metric is now completely broken down in my DataDogHQ dashboard. I can see where the distribution of traffic is going. And, I can filter down to a single tag (not shown in the screenshot) if I want to see how the traffic to that route changes over time. And this is just for a "count". Imagine that this was a timing (histogram) metric - I could see which routes take the longest to render and where my site might benefit from better caching.
Are you beginning to see the possibilities here?
To take advantage of this DataDog StatsD extension, I've added a new client to my StatsDGateway library - DogStatsDClient.cfc. The DogStatsDClient ColdFusion component supports all of the core StatsD methods; plus, it adds the histogram() method and optional tagging arguments to each [relevant] metric method.
With the addition of tagging, most methods now allow for two optional arguments: rate (for sampling) and tags. As such, the method signatures in this client are a bit more flexible than in the core client:
Count Metrics
- count( key, delta )
- count( key, delta, rate )
- count( key, delta, tags )
- count( key, delta, rate, tags )
- increment( key )
- increment( key, delta )
- increment( key, delta, rate )
- increment( key, delta, tags )
- increment( key, delta, rate, tags )
- decrement( key )
- decrement( key, delta )
- decrement( key, delta, rate )
- decrement( key, delta, tags )
- decrement( key, delta, rate, tags )
Gauge Metrics
NOTE: DogStatsD does not support sampling on gauges. It will be ignored.
- gauge( key, value )
- gauge( key, value, tags )
- incrementGauge( key, delta )
- incrementGauge( key, delta, tags )
- decrementGauge( key, delta )
- decrementGauge( key, delta, tags )
Timing Metrics
NOTE: DogStatsD implements timings as histograms under the hood.
- timing( key, duration )
- timing( key, duration, rate )
- timing( key, duration, tags )
- timing( key, duration, rate, tags )
Histogram Metrics
- histogram( key, value )
- histogram( key, value, rate )
- histogram( key, value, tags )
- histogram( key, value, rate, tags )
Unique Sets Metrics
NOTE: DogStatsD does not support sampling on sets. It will be ignored.
- unique( group, member )
- unique( group, member, tags )
The StatsDGateway.cfc provides a special method for creating the DogStatsDClient: StatsDGateway.createDogStatsClient().
DataDog has several other platform-oriented extensions for the StatsD protocol which my library does not yet support. But, I intend to add those shortly. In the meantime, however, I'm going to be noodling on this tagging functionality and how I can squeeze as much value out of it as possible.
Reader Comments
@All,
Just a quick update -- I added the "Events" extension for DogStatsD:
www.bennadel.com/blog/3337-adding-event-support-for-my-datadog-dogstatsd-coldfusion-component.htm
The .event() method allows arbitrary events to be reported back to DataDogHQ, where they can be mapped over any graph, allowing engineers to correlate system events with changes in system performance.
@All,
One more quick update -- I added the "Service Check" extensions for DogStatsD:
www.bennadel.com/blog/3338-adding-service-check-support-for-my-datadog-dogstatsd-coldfusion-component.htm
The .serviceCheck() method allows applications to report service health back to DataDogHQ where it can be visualized, monitored, and used to send alerts.